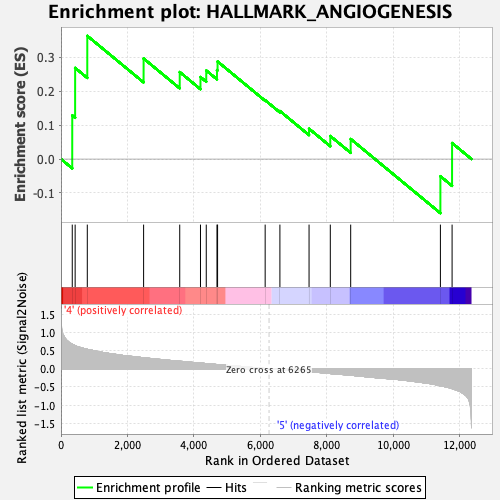
Profile of the Running ES Score & Positions of GeneSet Members on the Rank Ordered List
| Dataset | HSC.HSC_Pheno.cls#Group6_versus_Group8.HSC_Pheno.cls#Group6_versus_Group8_repos |
| Phenotype | HSC_Pheno.cls#Group6_versus_Group8_repos |
| Upregulated in class | 4 |
| GeneSet | HALLMARK_ANGIOGENESIS |
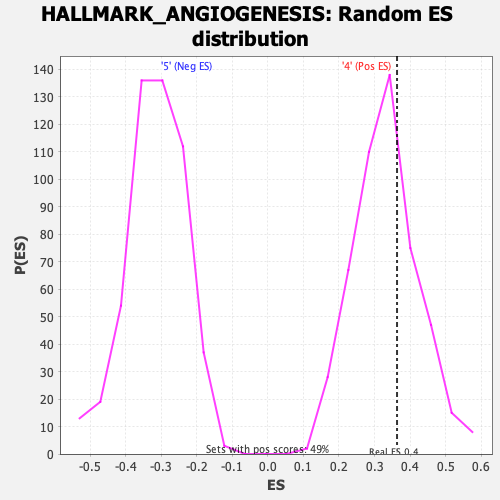
| Enrichment Score (ES) | 0.36346444 |
| Normalized Enrichment Score (NES) | 1.0935864 |
| Nominal p-value | 0.34285715 |
| FDR q-value | 0.65931636 |
| FWER p-Value | 0.977 |
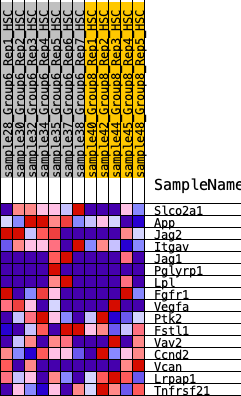
| SYMBOL | RANK IN GENE LIST | RANK METRIC SCORE | RUNNING ES | CORE ENRICHMENT | |
|---|---|---|---|---|---|
| 1 | Slco2a1 | 339 | 0.672 | 0.1287 | Yes |
| 2 | App | 426 | 0.634 | 0.2689 | Yes |
| 3 | Jag2 | 792 | 0.534 | 0.3635 | Yes |
| 4 | Itgav | 2488 | 0.303 | 0.2967 | No |
| 5 | Jag1 | 3576 | 0.207 | 0.2567 | No |
| 6 | Pglyrp1 | 4201 | 0.155 | 0.2420 | No |
| 7 | Lpl | 4375 | 0.143 | 0.2613 | No |
| 8 | Fgfr1 | 4698 | 0.117 | 0.2624 | No |
| 9 | Vegfa | 4716 | 0.116 | 0.2879 | No |
| 10 | Ptk2 | 6149 | 0.007 | 0.1735 | No |
| 11 | Fstl1 | 6593 | -0.017 | 0.1417 | No |
| 12 | Vav2 | 7471 | -0.081 | 0.0895 | No |
| 13 | Ccnd2 | 8111 | -0.130 | 0.0680 | No |
| 14 | Vcan | 8725 | -0.176 | 0.0592 | No |
| 15 | Lrpap1 | 11427 | -0.469 | -0.0507 | No |
| 16 | Tnfrsf21 | 11779 | -0.544 | 0.0473 | No |