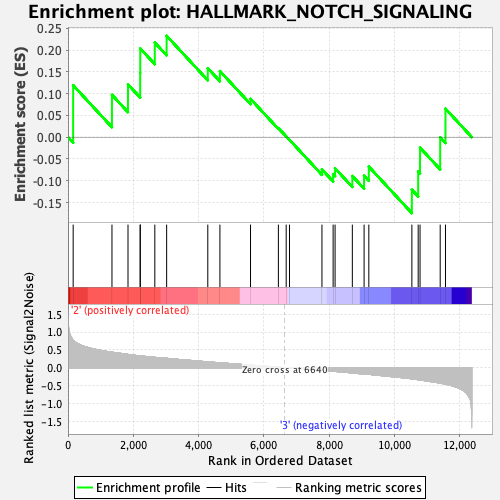
Profile of the Running ES Score & Positions of GeneSet Members on the Rank Ordered List
| Dataset | HSC.HSC_Pheno.cls#Group3_versus_Group4.HSC_Pheno.cls#Group3_versus_Group4_repos |
| Phenotype | HSC_Pheno.cls#Group3_versus_Group4_repos |
| Upregulated in class | 2 |
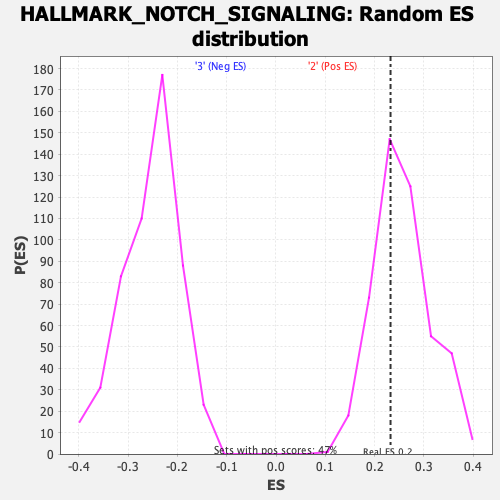
| GeneSet | HALLMARK_NOTCH_SIGNALING |
| Enrichment Score (ES) | 0.23243842 |
| Normalized Enrichment Score (NES) | 0.90235555 |
| Nominal p-value | 0.64270616 |
| FDR q-value | 0.9651584 |
| FWER p-Value | 1.0 |
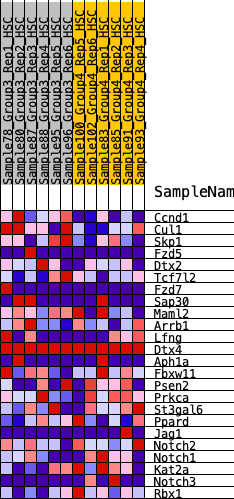
| SYMBOL | RANK IN GENE LIST | RANK METRIC SCORE | RUNNING ES | CORE ENRICHMENT | |
|---|---|---|---|---|---|
| 1 | Ccnd1 | 158 | 0.770 | 0.1190 | Yes |
| 2 | Cul1 | 1346 | 0.434 | 0.0972 | Yes |
| 3 | Skp1 | 1837 | 0.371 | 0.1210 | Yes |
| 4 | Fzd5 | 2210 | 0.329 | 0.1472 | Yes |
| 5 | Dtx2 | 2212 | 0.329 | 0.2035 | Yes |
| 6 | Tcf7l2 | 2658 | 0.289 | 0.2170 | Yes |
| 7 | Fzd7 | 3020 | 0.261 | 0.2324 | Yes |
| 8 | Sap30 | 4280 | 0.163 | 0.1583 | No |
| 9 | Maml2 | 4651 | 0.136 | 0.1516 | No |
| 10 | Arrb1 | 5588 | 0.071 | 0.0879 | No |
| 11 | Lfng | 6441 | 0.012 | 0.0209 | No |
| 12 | Dtx4 | 6680 | 0.000 | 0.0016 | No |
| 13 | Aph1a | 6781 | -0.002 | -0.0060 | No |
| 14 | Fbxw11 | 7775 | -0.073 | -0.0740 | No |
| 15 | Psen2 | 8117 | -0.099 | -0.0847 | No |
| 16 | Prkca | 8177 | -0.105 | -0.0716 | No |
| 17 | St3gal6 | 8705 | -0.147 | -0.0891 | No |
| 18 | Ppard | 9065 | -0.176 | -0.0881 | No |
| 19 | Jag1 | 9210 | -0.188 | -0.0676 | No |
| 20 | Notch2 | 10528 | -0.314 | -0.1206 | No |
| 21 | Notch1 | 10721 | -0.337 | -0.0785 | No |
| 22 | Kat2a | 10778 | -0.345 | -0.0240 | No |
| 23 | Notch3 | 11395 | -0.429 | -0.0004 | No |
| 24 | Rbx1 | 11557 | -0.460 | 0.0653 | No |