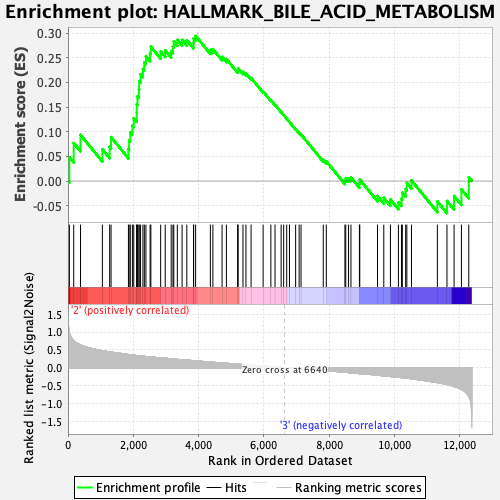
Profile of the Running ES Score & Positions of GeneSet Members on the Rank Ordered List
| Dataset | HSC.HSC_Pheno.cls#Group3_versus_Group4.HSC_Pheno.cls#Group3_versus_Group4_repos |
| Phenotype | HSC_Pheno.cls#Group3_versus_Group4_repos |
| Upregulated in class | 2 |
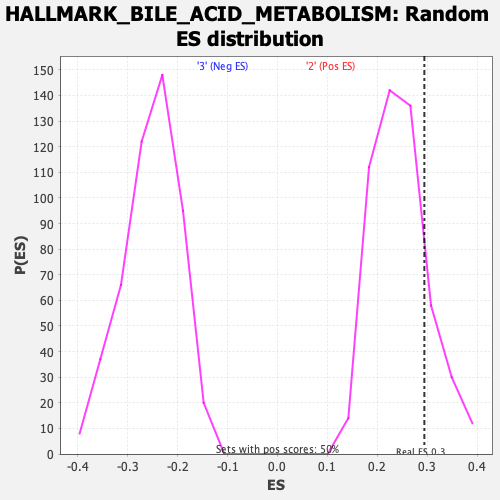
| GeneSet | HALLMARK_BILE_ACID_METABOLISM |
| Enrichment Score (ES) | 0.2942695 |
| Normalized Enrichment Score (NES) | 1.2037642 |
| Nominal p-value | 0.18055555 |
| FDR q-value | 0.4123807 |
| FWER p-Value | 0.93 |
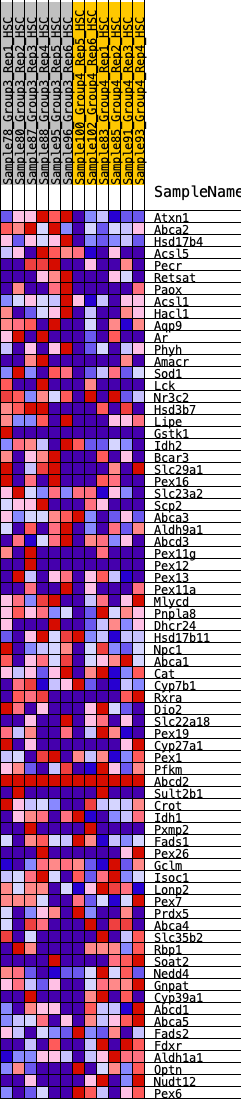
| SYMBOL | RANK IN GENE LIST | RANK METRIC SCORE | RUNNING ES | CORE ENRICHMENT | |
|---|---|---|---|---|---|
| 1 | Atxn1 | 42 | 0.984 | 0.0482 | Yes |
| 2 | Abca2 | 175 | 0.756 | 0.0771 | Yes |
| 3 | Hsd17b4 | 383 | 0.639 | 0.0937 | Yes |
| 4 | Acsl5 | 1052 | 0.476 | 0.0643 | Yes |
| 5 | Pecr | 1276 | 0.443 | 0.0694 | Yes |
| 6 | Retsat | 1318 | 0.439 | 0.0891 | Yes |
| 7 | Paox | 1850 | 0.368 | 0.0652 | Yes |
| 8 | Acsl1 | 1871 | 0.366 | 0.0827 | Yes |
| 9 | Hacl1 | 1907 | 0.362 | 0.0988 | Yes |
| 10 | Aqp9 | 1971 | 0.354 | 0.1123 | Yes |
| 11 | Ar | 2013 | 0.350 | 0.1273 | Yes |
| 12 | Phyh | 2103 | 0.340 | 0.1378 | Yes |
| 13 | Amacr | 2105 | 0.339 | 0.1555 | Yes |
| 14 | Sod1 | 2126 | 0.338 | 0.1716 | Yes |
| 15 | Lck | 2170 | 0.334 | 0.1856 | Yes |
| 16 | Nr3c2 | 2179 | 0.333 | 0.2025 | Yes |
| 17 | Hsd3b7 | 2221 | 0.328 | 0.2163 | Yes |
| 18 | Lipe | 2294 | 0.321 | 0.2273 | Yes |
| 19 | Gstk1 | 2337 | 0.318 | 0.2406 | Yes |
| 20 | Idh2 | 2386 | 0.313 | 0.2531 | Yes |
| 21 | Bcar3 | 2513 | 0.302 | 0.2586 | Yes |
| 22 | Slc29a1 | 2537 | 0.299 | 0.2724 | Yes |
| 23 | Pex16 | 2837 | 0.276 | 0.2626 | Yes |
| 24 | Slc23a2 | 2976 | 0.264 | 0.2652 | Yes |
| 25 | Scp2 | 3159 | 0.251 | 0.2635 | Yes |
| 26 | Abca3 | 3213 | 0.246 | 0.2721 | Yes |
| 27 | Aldh9a1 | 3239 | 0.243 | 0.2828 | Yes |
| 28 | Abcd3 | 3347 | 0.234 | 0.2863 | Yes |
| 29 | Pex11g | 3493 | 0.223 | 0.2862 | Yes |
| 30 | Pex12 | 3638 | 0.209 | 0.2854 | Yes |
| 31 | Pex13 | 3843 | 0.196 | 0.2791 | Yes |
| 32 | Pex11a | 3847 | 0.195 | 0.2891 | Yes |
| 33 | Mlycd | 3907 | 0.191 | 0.2943 | Yes |
| 34 | Pnpla8 | 4358 | 0.157 | 0.2659 | No |
| 35 | Dhcr24 | 4436 | 0.151 | 0.2675 | No |
| 36 | Hsd17b11 | 4717 | 0.132 | 0.2517 | No |
| 37 | Npc1 | 4849 | 0.123 | 0.2475 | No |
| 38 | Abca1 | 5193 | 0.099 | 0.2248 | No |
| 39 | Cat | 5210 | 0.098 | 0.2286 | No |
| 40 | Cyp7b1 | 5357 | 0.087 | 0.2213 | No |
| 41 | Rxra | 5448 | 0.081 | 0.2182 | No |
| 42 | Dio2 | 5605 | 0.069 | 0.2091 | No |
| 43 | Slc22a18 | 5974 | 0.044 | 0.1815 | No |
| 44 | Pex19 | 6211 | 0.030 | 0.1639 | No |
| 45 | Cyp27a1 | 6338 | 0.020 | 0.1547 | No |
| 46 | Pex1 | 6525 | 0.007 | 0.1399 | No |
| 47 | Pfkm | 6603 | 0.002 | 0.1338 | No |
| 48 | Abcd2 | 6696 | 0.000 | 0.1263 | No |
| 49 | Sult2b1 | 6780 | -0.002 | 0.1196 | No |
| 50 | Crot | 6969 | -0.016 | 0.1052 | No |
| 51 | Idh1 | 7076 | -0.023 | 0.0978 | No |
| 52 | Pxmp2 | 7134 | -0.027 | 0.0946 | No |
| 53 | Fads1 | 7815 | -0.076 | 0.0432 | No |
| 54 | Pex26 | 7908 | -0.084 | 0.0401 | No |
| 55 | Gclm | 8478 | -0.128 | 0.0006 | No |
| 56 | Isoc1 | 8504 | -0.130 | 0.0053 | No |
| 57 | Lonp2 | 8589 | -0.136 | 0.0057 | No |
| 58 | Pex7 | 8663 | -0.144 | 0.0073 | No |
| 59 | Prdx5 | 8922 | -0.166 | -0.0051 | No |
| 60 | Abca4 | 8933 | -0.167 | 0.0029 | No |
| 61 | Slc35b2 | 9476 | -0.210 | -0.0302 | No |
| 62 | Rbp1 | 9668 | -0.227 | -0.0339 | No |
| 63 | Soat2 | 9871 | -0.247 | -0.0374 | No |
| 64 | Nedd4 | 10116 | -0.269 | -0.0431 | No |
| 65 | Gnpat | 10209 | -0.278 | -0.0360 | No |
| 66 | Cyp39a1 | 10236 | -0.281 | -0.0234 | No |
| 67 | Abcd1 | 10338 | -0.290 | -0.0164 | No |
| 68 | Abca5 | 10374 | -0.295 | -0.0038 | No |
| 69 | Fads2 | 10516 | -0.313 | 0.0011 | No |
| 70 | Fdxr | 11308 | -0.419 | -0.0413 | No |
| 71 | Aldh1a1 | 11602 | -0.471 | -0.0404 | No |
| 72 | Optn | 11820 | -0.528 | -0.0304 | No |
| 73 | Nudt12 | 12045 | -0.606 | -0.0169 | No |
| 74 | Pex6 | 12270 | -0.814 | 0.0076 | No |