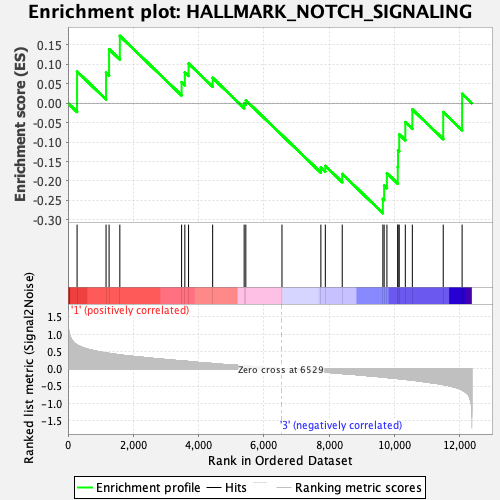
Profile of the Running ES Score & Positions of GeneSet Members on the Rank Ordered List
| Dataset | HSC.HSC_Pheno.cls#Group2_versus_Group4.HSC_Pheno.cls#Group2_versus_Group4_repos |
| Phenotype | HSC_Pheno.cls#Group2_versus_Group4_repos |
| Upregulated in class | 3 |
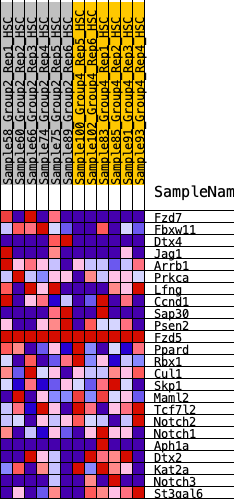
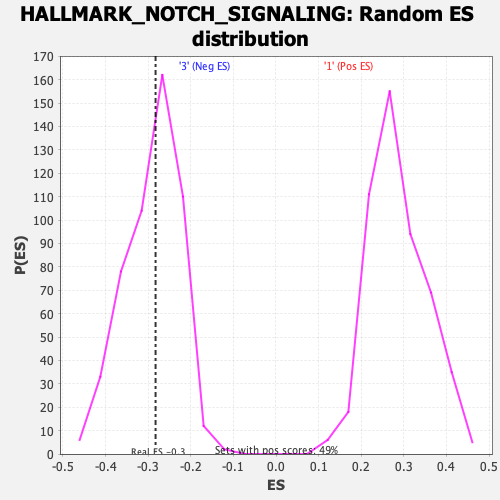
| GeneSet | HALLMARK_NOTCH_SIGNALING |
| Enrichment Score (ES) | -0.28264093 |
| Normalized Enrichment Score (NES) | -0.97435707 |
| Nominal p-value | 0.48915187 |
| FDR q-value | 1.0 |
| FWER p-Value | 1.0 |
| SYMBOL | RANK IN GENE LIST | RANK METRIC SCORE | RUNNING ES | CORE ENRICHMENT | |
|---|---|---|---|---|---|
| 1 | Fzd7 | 278 | 0.682 | 0.0815 | No |
| 2 | Fbxw11 | 1165 | 0.453 | 0.0788 | No |
| 3 | Dtx4 | 1258 | 0.443 | 0.1389 | No |
| 4 | Jag1 | 1587 | 0.399 | 0.1731 | No |
| 5 | Arrb1 | 3478 | 0.224 | 0.0541 | No |
| 6 | Prkca | 3577 | 0.217 | 0.0793 | No |
| 7 | Lfng | 3691 | 0.210 | 0.1021 | No |
| 8 | Ccnd1 | 4429 | 0.150 | 0.0652 | No |
| 9 | Sap30 | 5393 | 0.081 | -0.0004 | No |
| 10 | Psen2 | 5444 | 0.078 | 0.0075 | No |
| 11 | Fzd5 | 6551 | 0.000 | -0.0821 | No |
| 12 | Ppard | 7742 | -0.088 | -0.1651 | No |
| 13 | Rbx1 | 7878 | -0.098 | -0.1611 | No |
| 14 | Cul1 | 8396 | -0.138 | -0.1819 | No |
| 15 | Skp1 | 9640 | -0.241 | -0.2460 | Yes |
| 16 | Maml2 | 9679 | -0.245 | -0.2117 | Yes |
| 17 | Tcf7l2 | 9764 | -0.253 | -0.1799 | Yes |
| 18 | Notch2 | 10096 | -0.282 | -0.1637 | Yes |
| 19 | Notch1 | 10104 | -0.283 | -0.1211 | Yes |
| 20 | Aph1a | 10141 | -0.287 | -0.0803 | Yes |
| 21 | Dtx2 | 10327 | -0.306 | -0.0486 | Yes |
| 22 | Kat2a | 10542 | -0.328 | -0.0159 | Yes |
| 23 | Notch3 | 11488 | -0.457 | -0.0228 | Yes |
| 24 | St3gal6 | 12066 | -0.614 | 0.0241 | Yes |