Profile of the Running ES Score & Positions of GeneSet Members on the Rank Ordered List
| Dataset | HSC.HSC_Pheno.cls#Group2_versus_Group3.HSC_Pheno.cls#Group2_versus_Group3_repos |
| Phenotype | HSC_Pheno.cls#Group2_versus_Group3_repos |
| Upregulated in class | 2 |
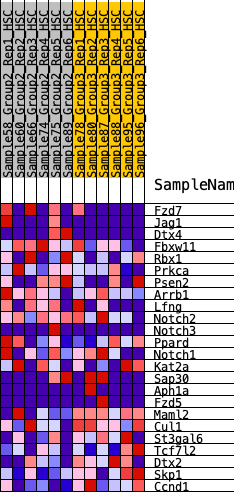
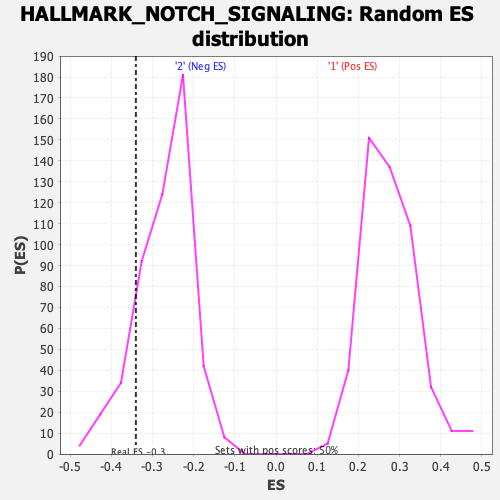
| GeneSet | HALLMARK_NOTCH_SIGNALING |
| Enrichment Score (ES) | -0.34021074 |
| Normalized Enrichment Score (NES) | -1.262399 |
| Nominal p-value | 0.14285715 |
| FDR q-value | 0.5056459 |
| FWER p-Value | 0.835 |
| SYMBOL | RANK IN GENE LIST | RANK METRIC SCORE | RUNNING ES | CORE ENRICHMENT | |
|---|---|---|---|---|---|
| 1 | Fzd7 | 1022 | 0.454 | -0.0227 | No |
| 2 | Jag1 | 1066 | 0.446 | 0.0328 | No |
| 3 | Dtx4 | 1086 | 0.443 | 0.0898 | No |
| 4 | Fbxw11 | 1126 | 0.436 | 0.1444 | No |
| 5 | Rbx1 | 1849 | 0.346 | 0.1316 | No |
| 6 | Prkca | 2082 | 0.321 | 0.1553 | No |
| 7 | Psen2 | 3751 | 0.163 | 0.0417 | No |
| 8 | Arrb1 | 3815 | 0.158 | 0.0576 | No |
| 9 | Lfng | 3852 | 0.156 | 0.0753 | No |
| 10 | Notch2 | 3895 | 0.152 | 0.0920 | No |
| 11 | Notch3 | 4470 | 0.110 | 0.0601 | No |
| 12 | Ppard | 4782 | 0.088 | 0.0466 | No |
| 13 | Notch1 | 4886 | 0.080 | 0.0489 | No |
| 14 | Kat2a | 5828 | 0.013 | -0.0257 | No |
| 15 | Sap30 | 7346 | -0.093 | -0.1363 | No |
| 16 | Aph1a | 9796 | -0.286 | -0.2969 | Yes |
| 17 | Fzd5 | 10331 | -0.329 | -0.2966 | Yes |
| 18 | Maml2 | 10672 | -0.367 | -0.2755 | Yes |
| 19 | Cul1 | 10880 | -0.397 | -0.2398 | Yes |
| 20 | St3gal6 | 10950 | -0.408 | -0.1914 | Yes |
| 21 | Tcf7l2 | 11001 | -0.416 | -0.1404 | Yes |
| 22 | Dtx2 | 11766 | -0.555 | -0.1288 | Yes |
| 23 | Skp1 | 11965 | -0.626 | -0.0619 | Yes |
| 24 | Ccnd1 | 12137 | -0.711 | 0.0183 | Yes |