Profile of the Running ES Score & Positions of GeneSet Members on the Rank Ordered List
| Dataset | HSC.HSC_Pheno.cls#Group1_versus_Group4.HSC_Pheno.cls#Group1_versus_Group4_repos |
| Phenotype | HSC_Pheno.cls#Group1_versus_Group4_repos |
| Upregulated in class | 3 |
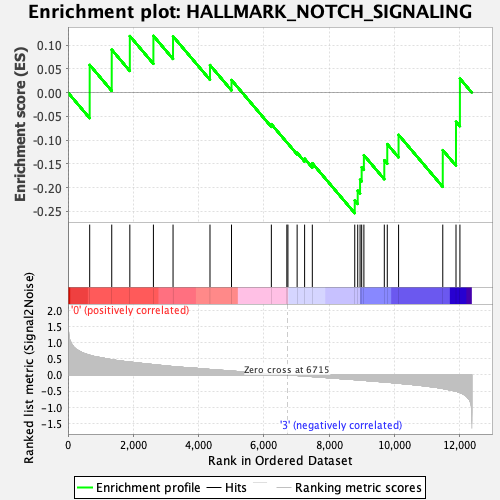
| GeneSet | HALLMARK_NOTCH_SIGNALING |
| Enrichment Score (ES) | -0.25407523 |
| Normalized Enrichment Score (NES) | -0.8779196 |
| Nominal p-value | 0.6799163 |
| FDR q-value | 0.94424194 |
| FWER p-Value | 1.0 |
| SYMBOL | RANK IN GENE LIST | RANK METRIC SCORE | RUNNING ES | CORE ENRICHMENT | |
|---|---|---|---|---|---|
| 1 | Fzd7 | 664 | 0.607 | 0.0583 | No |
| 2 | Jag1 | 1339 | 0.470 | 0.0904 | No |
| 3 | Fzd5 | 1893 | 0.398 | 0.1192 | No |
| 4 | Ccnd1 | 2615 | 0.318 | 0.1195 | No |
| 5 | Lfng | 3216 | 0.258 | 0.1186 | No |
| 6 | Prkca | 4347 | 0.168 | 0.0580 | No |
| 7 | Notch1 | 5006 | 0.118 | 0.0265 | No |
| 8 | Cul1 | 6226 | 0.031 | -0.0666 | No |
| 9 | Aph1a | 6700 | 0.001 | -0.1048 | No |
| 10 | Dtx4 | 6733 | 0.000 | -0.1074 | No |
| 11 | Notch2 | 7015 | -0.017 | -0.1269 | No |
| 12 | Psen2 | 7244 | -0.034 | -0.1392 | No |
| 13 | Dtx2 | 7480 | -0.051 | -0.1489 | No |
| 14 | Skp1 | 8779 | -0.144 | -0.2274 | Yes |
| 15 | Fbxw11 | 8870 | -0.151 | -0.2068 | Yes |
| 16 | Sap30 | 8942 | -0.158 | -0.1834 | Yes |
| 17 | Tcf7l2 | 8991 | -0.162 | -0.1574 | Yes |
| 18 | Arrb1 | 9059 | -0.167 | -0.1320 | Yes |
| 19 | Maml2 | 9684 | -0.216 | -0.1427 | Yes |
| 20 | Notch3 | 9775 | -0.224 | -0.1086 | Yes |
| 21 | Rbx1 | 10121 | -0.257 | -0.0891 | Yes |
| 22 | Ppard | 11474 | -0.418 | -0.1213 | Yes |
| 23 | St3gal6 | 11879 | -0.503 | -0.0612 | Yes |
| 24 | Kat2a | 11999 | -0.543 | 0.0295 | Yes |

