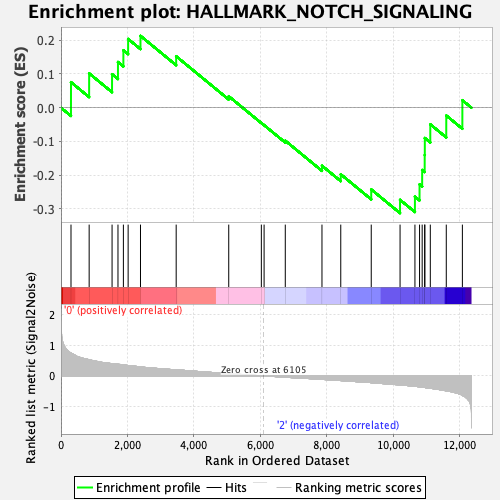
Profile of the Running ES Score & Positions of GeneSet Members on the Rank Ordered List
| Dataset | HSC.HSC_Pheno.cls#Group1_versus_Group3.HSC_Pheno.cls#Group1_versus_Group3_repos |
| Phenotype | HSC_Pheno.cls#Group1_versus_Group3_repos |
| Upregulated in class | 2 |
| GeneSet | HALLMARK_NOTCH_SIGNALING |
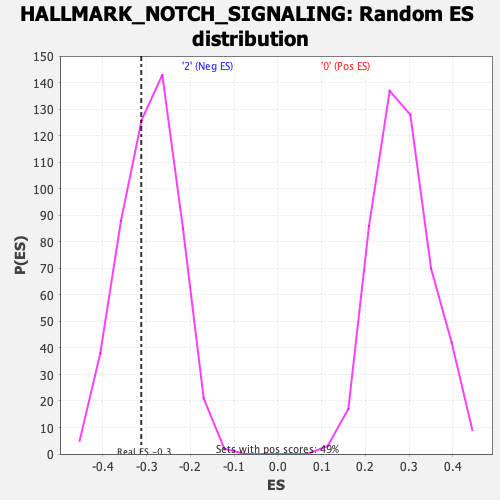
| Enrichment Score (ES) | -0.31243306 |
| Normalized Enrichment Score (NES) | -1.0676463 |
| Nominal p-value | 0.37204725 |
| FDR q-value | 0.81315476 |
| FWER p-Value | 0.996 |
| SYMBOL | RANK IN GENE LIST | RANK METRIC SCORE | RUNNING ES | CORE ENRICHMENT | |
|---|---|---|---|---|---|
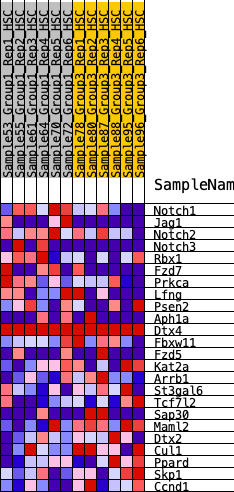
| 1 | Notch1 | 301 | 0.752 | 0.0757 | No |
| 2 | Jag1 | 848 | 0.529 | 0.1018 | No |
| 3 | Notch2 | 1538 | 0.401 | 0.0993 | No |
| 4 | Notch3 | 1716 | 0.380 | 0.1355 | No |
| 5 | Rbx1 | 1879 | 0.360 | 0.1703 | No |
| 6 | Fzd7 | 2022 | 0.339 | 0.2039 | No |
| 7 | Prkca | 2394 | 0.294 | 0.2130 | No |
| 8 | Lfng | 3469 | 0.199 | 0.1525 | No |
| 9 | Psen2 | 5052 | 0.073 | 0.0340 | No |
| 10 | Aph1a | 6034 | 0.004 | -0.0450 | No |
| 11 | Dtx4 | 6117 | 0.000 | -0.0517 | No |
| 12 | Fbxw11 | 6755 | -0.042 | -0.0977 | No |
| 13 | Fzd5 | 7860 | -0.115 | -0.1719 | No |
| 14 | Kat2a | 8426 | -0.153 | -0.1973 | No |
| 15 | Arrb1 | 9344 | -0.221 | -0.2422 | No |
| 16 | St3gal6 | 10212 | -0.297 | -0.2729 | Yes |
| 17 | Tcf7l2 | 10660 | -0.343 | -0.2635 | Yes |
| 18 | Sap30 | 10799 | -0.358 | -0.2271 | Yes |
| 19 | Maml2 | 10878 | -0.367 | -0.1845 | Yes |
| 20 | Dtx2 | 10954 | -0.379 | -0.1401 | Yes |
| 21 | Cul1 | 10958 | -0.380 | -0.0898 | Yes |
| 22 | Ppard | 11123 | -0.404 | -0.0492 | Yes |
| 23 | Skp1 | 11604 | -0.488 | -0.0231 | Yes |
| 24 | Ccnd1 | 12089 | -0.635 | 0.0222 | Yes |