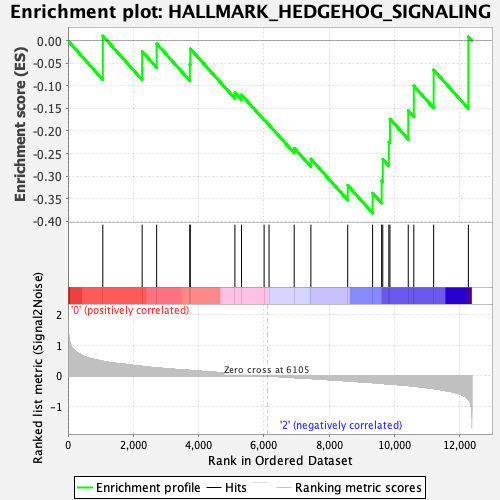
Profile of the Running ES Score & Positions of GeneSet Members on the Rank Ordered List
| Dataset | HSC.HSC_Pheno.cls#Group1_versus_Group3.HSC_Pheno.cls#Group1_versus_Group3_repos |
| Phenotype | HSC_Pheno.cls#Group1_versus_Group3_repos |
| Upregulated in class | 2 |
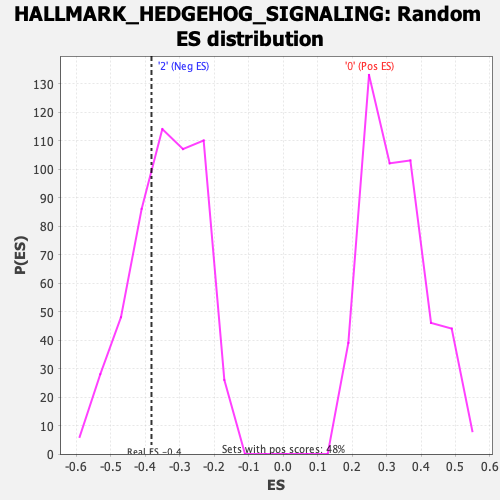
| GeneSet | HALLMARK_HEDGEHOG_SIGNALING |
| Enrichment Score (ES) | -0.38192087 |
| Normalized Enrichment Score (NES) | -1.1295308 |
| Nominal p-value | 0.31047618 |
| FDR q-value | 0.7350363 |
| FWER p-Value | 0.987 |
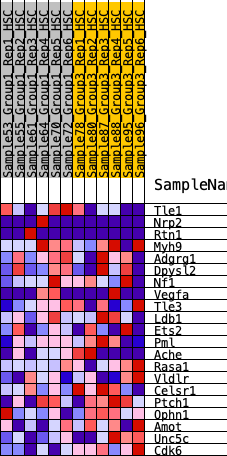
| SYMBOL | RANK IN GENE LIST | RANK METRIC SCORE | RUNNING ES | CORE ENRICHMENT | |
|---|---|---|---|---|---|
| 1 | Tle1 | 1066 | 0.477 | 0.0106 | No |
| 2 | Nrp2 | 2270 | 0.310 | -0.0238 | No |
| 3 | Rtn1 | 2714 | 0.261 | -0.0066 | No |
| 4 | Myh9 | 3728 | 0.178 | -0.0524 | No |
| 5 | Adgrg1 | 3744 | 0.177 | -0.0177 | No |
| 6 | Dpysl2 | 5110 | 0.067 | -0.1145 | No |
| 7 | Nf1 | 5313 | 0.054 | -0.1199 | No |
| 8 | Vegfa | 6004 | 0.006 | -0.1746 | No |
| 9 | Tle3 | 6155 | -0.001 | -0.1865 | No |
| 10 | Ldb1 | 6925 | -0.054 | -0.2378 | No |
| 11 | Ets2 | 7436 | -0.085 | -0.2618 | No |
| 12 | Pml | 8564 | -0.162 | -0.3203 | No |
| 13 | Ache | 9326 | -0.219 | -0.3373 | Yes |
| 14 | Rasa1 | 9602 | -0.243 | -0.3100 | Yes |
| 15 | Vldlr | 9637 | -0.247 | -0.2625 | Yes |
| 16 | Celsr1 | 9823 | -0.261 | -0.2243 | Yes |
| 17 | Ptch1 | 9857 | -0.264 | -0.1732 | Yes |
| 18 | Ophn1 | 10417 | -0.315 | -0.1544 | Yes |
| 19 | Amot | 10587 | -0.335 | -0.1000 | Yes |
| 20 | Unc5c | 11195 | -0.416 | -0.0646 | Yes |
| 21 | Cdk6 | 12258 | -0.782 | 0.0085 | Yes |