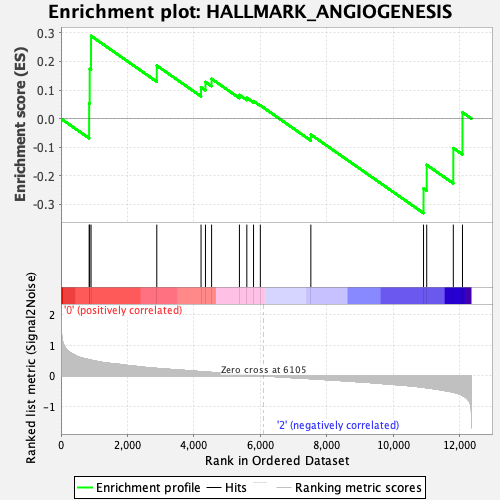
Profile of the Running ES Score & Positions of GeneSet Members on the Rank Ordered List
| Dataset | HSC.HSC_Pheno.cls#Group1_versus_Group3.HSC_Pheno.cls#Group1_versus_Group3_repos |
| Phenotype | HSC_Pheno.cls#Group1_versus_Group3_repos |
| Upregulated in class | 2 |
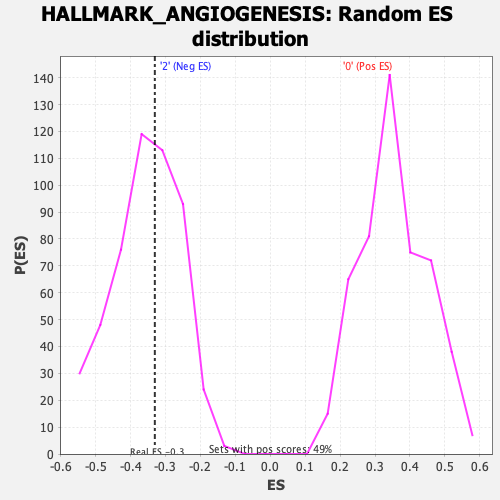
| GeneSet | HALLMARK_ANGIOGENESIS |
| Enrichment Score (ES) | -0.33045724 |
| Normalized Enrichment Score (NES) | -0.9299447 |
| Nominal p-value | 0.59090906 |
| FDR q-value | 0.7901408 |
| FWER p-Value | 1.0 |
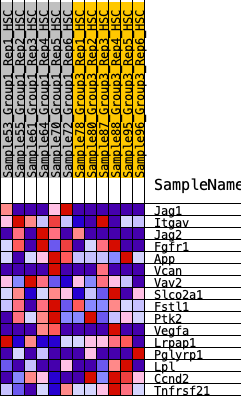
| SYMBOL | RANK IN GENE LIST | RANK METRIC SCORE | RUNNING ES | CORE ENRICHMENT | |
|---|---|---|---|---|---|
| 1 | Jag1 | 848 | 0.529 | 0.0536 | Yes |
| 2 | Itgav | 864 | 0.525 | 0.1737 | Yes |
| 3 | Jag2 | 905 | 0.514 | 0.2894 | Yes |
| 4 | Fgfr1 | 2885 | 0.244 | 0.1856 | No |
| 5 | App | 4218 | 0.137 | 0.1095 | No |
| 6 | Vcan | 4351 | 0.127 | 0.1283 | No |
| 7 | Vav2 | 4536 | 0.112 | 0.1393 | No |
| 8 | Slco2a1 | 5374 | 0.049 | 0.0829 | No |
| 9 | Fstl1 | 5597 | 0.034 | 0.0728 | No |
| 10 | Ptk2 | 5799 | 0.021 | 0.0614 | No |
| 11 | Vegfa | 6004 | 0.006 | 0.0463 | No |
| 12 | Lrpap1 | 7525 | -0.092 | -0.0557 | No |
| 13 | Pglyrp1 | 10919 | -0.374 | -0.2441 | No |
| 14 | Lpl | 11015 | -0.389 | -0.1618 | No |
| 15 | Ccnd2 | 11816 | -0.535 | -0.1029 | No |
| 16 | Tnfrsf21 | 12092 | -0.636 | 0.0219 | No |