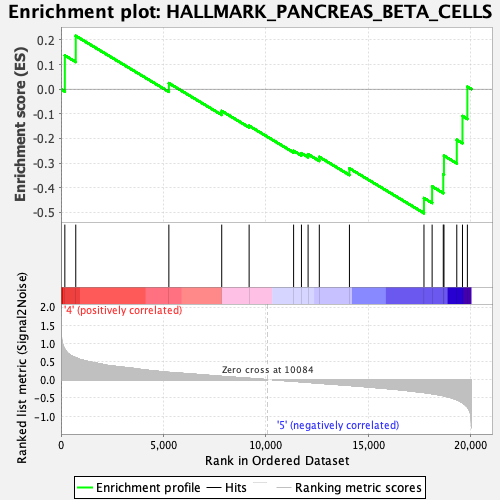
Profile of the Running ES Score & Positions of GeneSet Members on the Rank Ordered List
| Dataset | GMP.GMP.neu_Pheno.cls #Group6_versus_Group8.GMP.neu_Pheno.cls #Group6_versus_Group8_repos |
| Phenotype | GMP.neu_Pheno.cls#Group6_versus_Group8_repos |
| Upregulated in class | 5 |
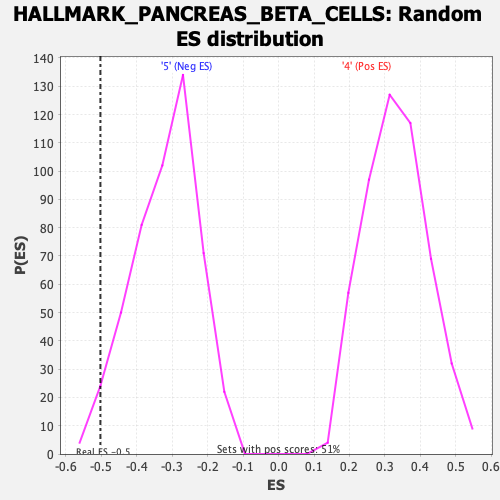
| GeneSet | HALLMARK_PANCREAS_BETA_CELLS |
| Enrichment Score (ES) | -0.5028725 |
| Normalized Enrichment Score (NES) | -1.5778992 |
| Nominal p-value | 0.016393442 |
| FDR q-value | 0.094658636 |
| FWER p-Value | 0.237 |
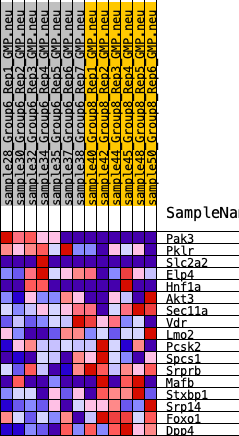
| SYMBOL | RANK IN GENE LIST | RANK METRIC SCORE | RUNNING ES | CORE ENRICHMENT | |
|---|---|---|---|---|---|
| 1 | Pak3 | 187 | 0.835 | 0.1370 | No |
| 2 | Pklr | 720 | 0.604 | 0.2163 | No |
| 3 | Slc2a2 | 5262 | 0.200 | 0.0245 | No |
| 4 | Elp4 | 7841 | 0.091 | -0.0885 | No |
| 5 | Hnf1a | 9178 | 0.038 | -0.1486 | No |
| 6 | Akt3 | 11348 | -0.039 | -0.2502 | No |
| 7 | Sec11a | 11731 | -0.054 | -0.2598 | No |
| 8 | Vdr | 12055 | -0.068 | -0.2639 | No |
| 9 | Lmo2 | 12602 | -0.093 | -0.2749 | No |
| 10 | Pcsk2 | 14072 | -0.154 | -0.3212 | No |
| 11 | Spcs1 | 17708 | -0.349 | -0.4418 | Yes |
| 12 | Srprb | 18106 | -0.383 | -0.3946 | Yes |
| 13 | Mafb | 18650 | -0.435 | -0.3454 | Yes |
| 14 | Stxbp1 | 18684 | -0.440 | -0.2699 | Yes |
| 15 | Srp14 | 19309 | -0.546 | -0.2055 | Yes |
| 16 | Foxo1 | 19587 | -0.629 | -0.1090 | Yes |
| 17 | Dpp4 | 19826 | -0.747 | 0.0100 | Yes |