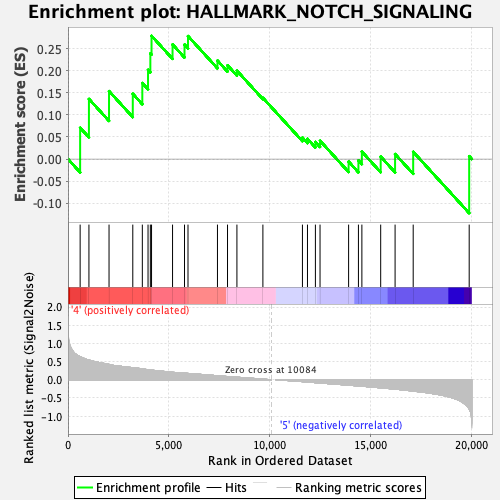
Profile of the Running ES Score & Positions of GeneSet Members on the Rank Ordered List
| Dataset | GMP.GMP.neu_Pheno.cls #Group6_versus_Group8.GMP.neu_Pheno.cls #Group6_versus_Group8_repos |
| Phenotype | GMP.neu_Pheno.cls#Group6_versus_Group8_repos |
| Upregulated in class | 4 |
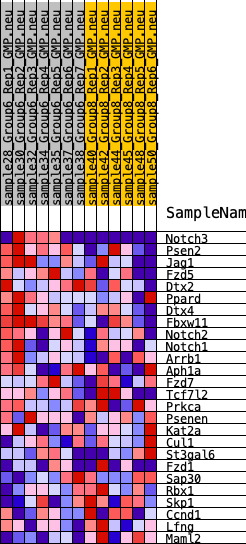
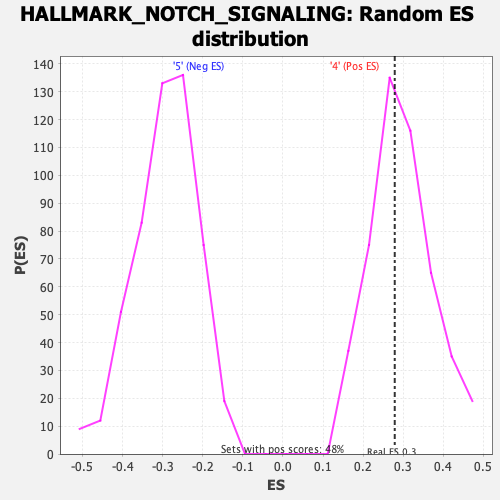
| GeneSet | HALLMARK_NOTCH_SIGNALING |
| Enrichment Score (ES) | 0.27888283 |
| Normalized Enrichment Score (NES) | 0.9428529 |
| Nominal p-value | 0.5809129 |
| FDR q-value | 0.6762224 |
| FWER p-Value | 1.0 |
| SYMBOL | RANK IN GENE LIST | RANK METRIC SCORE | RUNNING ES | CORE ENRICHMENT | |
|---|---|---|---|---|---|
| 1 | Notch3 | 602 | 0.630 | 0.0709 | Yes |
| 2 | Psen2 | 1038 | 0.542 | 0.1361 | Yes |
| 3 | Jag1 | 2035 | 0.421 | 0.1538 | Yes |
| 4 | Fzd5 | 3213 | 0.329 | 0.1477 | Yes |
| 5 | Dtx2 | 3686 | 0.299 | 0.1721 | Yes |
| 6 | Ppard | 3969 | 0.275 | 0.2020 | Yes |
| 7 | Dtx4 | 4084 | 0.267 | 0.2392 | Yes |
| 8 | Fbxw11 | 4143 | 0.266 | 0.2789 | Yes |
| 9 | Notch2 | 5185 | 0.204 | 0.2595 | No |
| 10 | Notch1 | 5778 | 0.183 | 0.2592 | No |
| 11 | Arrb1 | 5951 | 0.174 | 0.2784 | No |
| 12 | Aph1a | 7412 | 0.110 | 0.2229 | No |
| 13 | Fzd7 | 7911 | 0.088 | 0.2122 | No |
| 14 | Tcf7l2 | 8377 | 0.069 | 0.2001 | No |
| 15 | Prkca | 9665 | 0.018 | 0.1385 | No |
| 16 | Psenen | 11626 | -0.050 | 0.0486 | No |
| 17 | Kat2a | 11876 | -0.061 | 0.0459 | No |
| 18 | Cul1 | 12269 | -0.078 | 0.0388 | No |
| 19 | St3gal6 | 12499 | -0.088 | 0.0415 | No |
| 20 | Fzd1 | 13916 | -0.147 | -0.0057 | No |
| 21 | Sap30 | 14403 | -0.168 | -0.0030 | No |
| 22 | Rbx1 | 14574 | -0.176 | 0.0167 | No |
| 23 | Skp1 | 15507 | -0.221 | 0.0056 | No |
| 24 | Ccnd1 | 16221 | -0.259 | 0.0114 | No |
| 25 | Lfng | 17119 | -0.311 | 0.0164 | No |
| 26 | Maml2 | 19896 | -0.804 | 0.0065 | No |