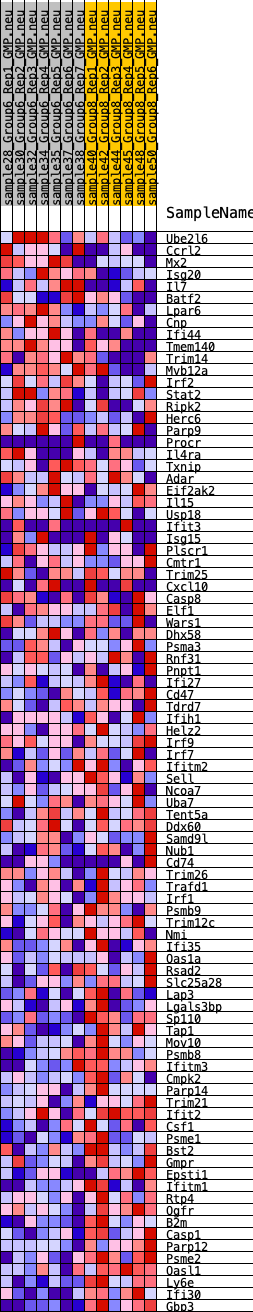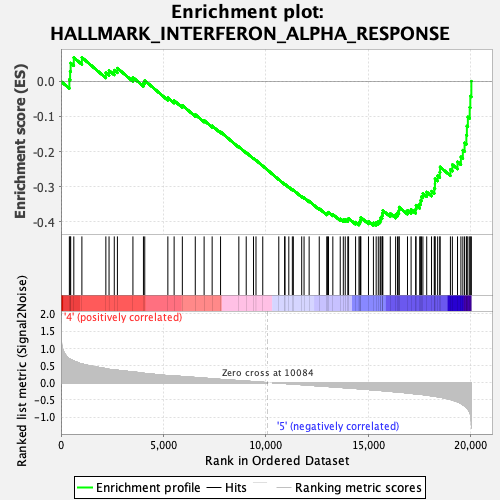
Profile of the Running ES Score & Positions of GeneSet Members on the Rank Ordered List
| Dataset | GMP.GMP.neu_Pheno.cls #Group6_versus_Group8.GMP.neu_Pheno.cls #Group6_versus_Group8_repos |
| Phenotype | GMP.neu_Pheno.cls#Group6_versus_Group8_repos |
| Upregulated in class | 5 |
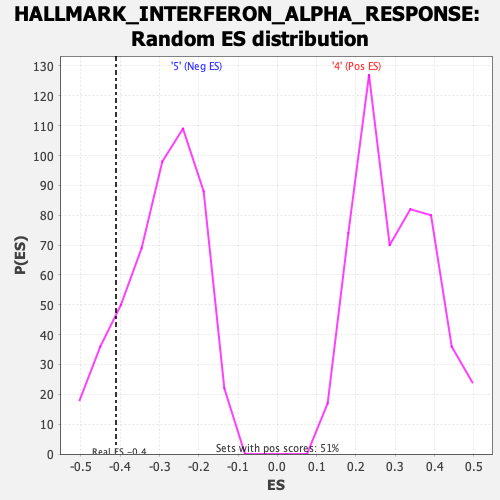
| GeneSet | HALLMARK_INTERFERON_ALPHA_RESPONSE |
| Enrichment Score (ES) | -0.41081035 |
| Normalized Enrichment Score (NES) | -1.4053695 |
| Nominal p-value | 0.13265306 |
| FDR q-value | 0.16167381 |
| FWER p-Value | 0.556 |
| SYMBOL | RANK IN GENE LIST | RANK METRIC SCORE | RUNNING ES | CORE ENRICHMENT | |
|---|---|---|---|---|---|
| 1 | Ube2l6 | 408 | 0.694 | 0.0053 | No |
| 2 | Ccrl2 | 445 | 0.678 | 0.0286 | No |
| 3 | Mx2 | 472 | 0.669 | 0.0521 | No |
| 4 | Isg20 | 625 | 0.626 | 0.0676 | No |
| 5 | Il7 | 1019 | 0.543 | 0.0681 | No |
| 6 | Batf2 | 2188 | 0.401 | 0.0244 | No |
| 7 | Lpar6 | 2344 | 0.386 | 0.0309 | No |
| 8 | Cnp | 2599 | 0.369 | 0.0318 | No |
| 9 | Ifi44 | 2752 | 0.359 | 0.0375 | No |
| 10 | Tmem140 | 3509 | 0.313 | 0.0112 | No |
| 11 | Trim14 | 4022 | 0.271 | -0.0044 | No |
| 12 | Mvb12a | 4086 | 0.267 | 0.0023 | No |
| 13 | Irf2 | 5213 | 0.202 | -0.0467 | No |
| 14 | Stat2 | 5519 | 0.193 | -0.0548 | No |
| 15 | Ripk2 | 5920 | 0.175 | -0.0684 | No |
| 16 | Herc6 | 6551 | 0.149 | -0.0945 | No |
| 17 | Parp9 | 6982 | 0.130 | -0.1112 | No |
| 18 | Procr | 7374 | 0.111 | -0.1267 | No |
| 19 | Il4ra | 7784 | 0.093 | -0.1438 | No |
| 20 | Txnip | 8676 | 0.058 | -0.1863 | No |
| 21 | Adar | 9036 | 0.044 | -0.2027 | No |
| 22 | Eif2ak2 | 9391 | 0.029 | -0.2194 | No |
| 23 | Il15 | 9513 | 0.024 | -0.2246 | No |
| 24 | Usp18 | 9843 | 0.010 | -0.2407 | No |
| 25 | Ifit3 | 10625 | -0.011 | -0.2795 | No |
| 26 | Isg15 | 10909 | -0.021 | -0.2929 | No |
| 27 | Plscr1 | 10929 | -0.022 | -0.2930 | No |
| 28 | Cmtr1 | 11114 | -0.030 | -0.3012 | No |
| 29 | Trim25 | 11287 | -0.037 | -0.3084 | No |
| 30 | Cxcl10 | 11335 | -0.038 | -0.3094 | No |
| 31 | Casp8 | 11743 | -0.055 | -0.3278 | No |
| 32 | Elf1 | 11858 | -0.060 | -0.3313 | No |
| 33 | Wars1 | 12106 | -0.071 | -0.3410 | No |
| 34 | Dhx58 | 12599 | -0.093 | -0.3622 | No |
| 35 | Psma3 | 12965 | -0.107 | -0.3766 | No |
| 36 | Rnf31 | 13006 | -0.109 | -0.3746 | No |
| 37 | Pnpt1 | 13051 | -0.110 | -0.3727 | No |
| 38 | Ifi27 | 13262 | -0.120 | -0.3787 | No |
| 39 | Cd47 | 13623 | -0.136 | -0.3918 | No |
| 40 | Tdrd7 | 13773 | -0.142 | -0.3940 | No |
| 41 | Ifih1 | 13867 | -0.146 | -0.3933 | No |
| 42 | Helz2 | 13993 | -0.151 | -0.3939 | No |
| 43 | Irf9 | 14030 | -0.153 | -0.3901 | No |
| 44 | Irf7 | 14372 | -0.167 | -0.4010 | No |
| 45 | Ifitm2 | 14538 | -0.174 | -0.4028 | No |
| 46 | Sell | 14582 | -0.177 | -0.3984 | No |
| 47 | Ncoa7 | 14614 | -0.178 | -0.3934 | No |
| 48 | Uba7 | 14628 | -0.179 | -0.3874 | No |
| 49 | Tent5a | 15001 | -0.197 | -0.3988 | No |
| 50 | Ddx60 | 15242 | -0.208 | -0.4031 | Yes |
| 51 | Samd9l | 15376 | -0.215 | -0.4018 | Yes |
| 52 | Nub1 | 15479 | -0.220 | -0.3988 | Yes |
| 53 | Cd74 | 15567 | -0.224 | -0.3949 | Yes |
| 54 | Trim26 | 15600 | -0.226 | -0.3881 | Yes |
| 55 | Trafd1 | 15666 | -0.229 | -0.3829 | Yes |
| 56 | Irf1 | 15681 | -0.230 | -0.3751 | Yes |
| 57 | Psmb9 | 15702 | -0.230 | -0.3675 | Yes |
| 58 | Trim12c | 16065 | -0.250 | -0.3764 | Yes |
| 59 | Nmi | 16326 | -0.262 | -0.3797 | Yes |
| 60 | Ifi35 | 16418 | -0.267 | -0.3744 | Yes |
| 61 | Oas1a | 16486 | -0.272 | -0.3677 | Yes |
| 62 | Rsad2 | 16497 | -0.273 | -0.3581 | Yes |
| 63 | Slc25a28 | 16904 | -0.297 | -0.3675 | Yes |
| 64 | Lap3 | 17080 | -0.309 | -0.3648 | Yes |
| 65 | Lgals3bp | 17304 | -0.323 | -0.3640 | Yes |
| 66 | Sp110 | 17320 | -0.324 | -0.3527 | Yes |
| 67 | Tap1 | 17500 | -0.335 | -0.3493 | Yes |
| 68 | Mov10 | 17545 | -0.337 | -0.3390 | Yes |
| 69 | Psmb8 | 17585 | -0.339 | -0.3284 | Yes |
| 70 | Ifitm3 | 17656 | -0.344 | -0.3192 | Yes |
| 71 | Cmpk2 | 17842 | -0.359 | -0.3151 | Yes |
| 72 | Parp14 | 18077 | -0.380 | -0.3128 | Yes |
| 73 | Trim21 | 18210 | -0.391 | -0.3049 | Yes |
| 74 | Ifit2 | 18244 | -0.394 | -0.2920 | Yes |
| 75 | Csf1 | 18247 | -0.394 | -0.2775 | Yes |
| 76 | Psme1 | 18376 | -0.406 | -0.2688 | Yes |
| 77 | Bst2 | 18481 | -0.417 | -0.2586 | Yes |
| 78 | Gmpr | 18494 | -0.418 | -0.2437 | Yes |
| 79 | Epsti1 | 18998 | -0.485 | -0.2510 | Yes |
| 80 | Ifitm1 | 19093 | -0.502 | -0.2371 | Yes |
| 81 | Rtp4 | 19345 | -0.553 | -0.2292 | Yes |
| 82 | Ogfr | 19510 | -0.602 | -0.2151 | Yes |
| 83 | B2m | 19605 | -0.640 | -0.1961 | Yes |
| 84 | Casp1 | 19689 | -0.672 | -0.1753 | Yes |
| 85 | Parp12 | 19777 | -0.719 | -0.1531 | Yes |
| 86 | Psme2 | 19802 | -0.730 | -0.1272 | Yes |
| 87 | Oasl1 | 19850 | -0.761 | -0.1014 | Yes |
| 88 | Ly6e | 19940 | -0.858 | -0.0740 | Yes |
| 89 | Ifi30 | 19969 | -0.904 | -0.0419 | Yes |
| 90 | Gbp3 | 20020 | -1.207 | 0.0003 | Yes |