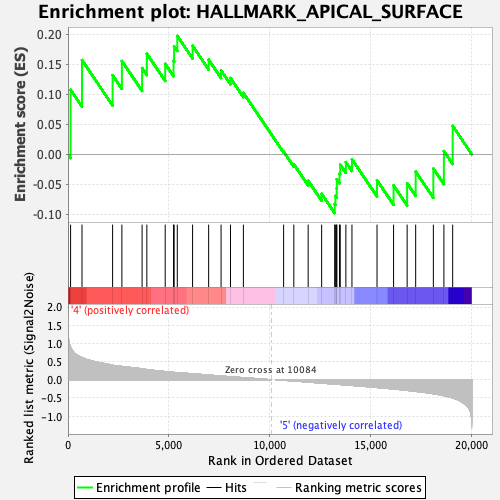
Profile of the Running ES Score & Positions of GeneSet Members on the Rank Ordered List
| Dataset | GMP.GMP.neu_Pheno.cls #Group6_versus_Group8.GMP.neu_Pheno.cls #Group6_versus_Group8_repos |
| Phenotype | GMP.neu_Pheno.cls#Group6_versus_Group8_repos |
| Upregulated in class | 4 |
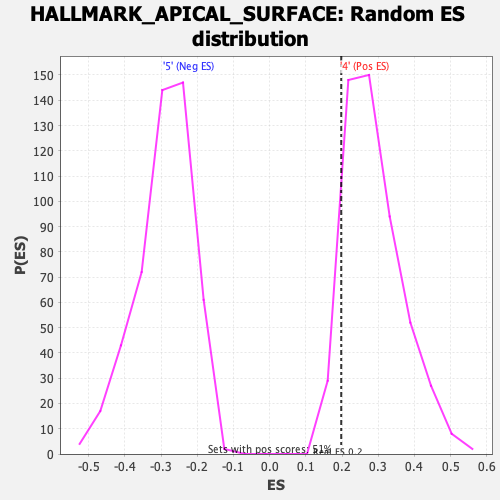
| GeneSet | HALLMARK_APICAL_SURFACE |
| Enrichment Score (ES) | 0.19761655 |
| Normalized Enrichment Score (NES) | 0.6863159 |
| Nominal p-value | 0.91568625 |
| FDR q-value | 0.91765314 |
| FWER p-Value | 1.0 |
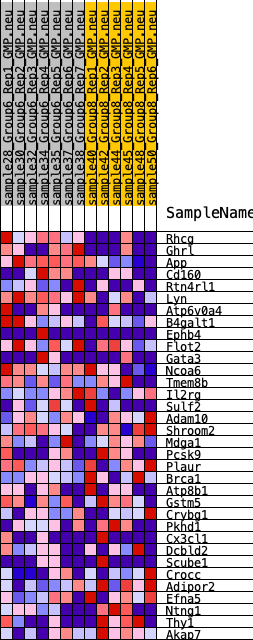
| SYMBOL | RANK IN GENE LIST | RANK METRIC SCORE | RUNNING ES | CORE ENRICHMENT | |
|---|---|---|---|---|---|
| 1 | Rhcg | 128 | 0.896 | 0.1077 | Yes |
| 2 | Ghrl | 694 | 0.611 | 0.1573 | Yes |
| 3 | App | 2212 | 0.398 | 0.1321 | Yes |
| 4 | Cd160 | 2672 | 0.365 | 0.1557 | Yes |
| 5 | Rtn4rl1 | 3674 | 0.300 | 0.1439 | Yes |
| 6 | Lyn | 3910 | 0.280 | 0.1678 | Yes |
| 7 | Atp6v0a4 | 4820 | 0.225 | 0.1510 | Yes |
| 8 | B4galt1 | 5235 | 0.202 | 0.1560 | Yes |
| 9 | Ephb4 | 5263 | 0.200 | 0.1802 | Yes |
| 10 | Flot2 | 5420 | 0.198 | 0.1976 | Yes |
| 11 | Gata3 | 6178 | 0.168 | 0.1812 | No |
| 12 | Ncoa6 | 6975 | 0.130 | 0.1579 | No |
| 13 | Tmem8b | 7591 | 0.101 | 0.1401 | No |
| 14 | Il2rg | 8058 | 0.083 | 0.1273 | No |
| 15 | Sulf2 | 8698 | 0.057 | 0.1026 | No |
| 16 | Adam10 | 10693 | -0.014 | 0.0046 | No |
| 17 | Shroom2 | 11199 | -0.032 | -0.0165 | No |
| 18 | Mdga1 | 11910 | -0.062 | -0.0441 | No |
| 19 | Pcsk9 | 12579 | -0.092 | -0.0658 | No |
| 20 | Plaur | 13226 | -0.119 | -0.0830 | No |
| 21 | Brca1 | 13260 | -0.120 | -0.0693 | No |
| 22 | Atp8b1 | 13325 | -0.122 | -0.0570 | No |
| 23 | Gstm5 | 13329 | -0.122 | -0.0415 | No |
| 24 | Crybg1 | 13467 | -0.129 | -0.0320 | No |
| 25 | Pkhd1 | 13501 | -0.130 | -0.0170 | No |
| 26 | Cx3cl1 | 13780 | -0.142 | -0.0129 | No |
| 27 | Dcbld2 | 14082 | -0.155 | -0.0081 | No |
| 28 | Scube1 | 15325 | -0.212 | -0.0432 | No |
| 29 | Crocc | 16146 | -0.254 | -0.0518 | No |
| 30 | Adipor2 | 16819 | -0.291 | -0.0483 | No |
| 31 | Efna5 | 17242 | -0.319 | -0.0288 | No |
| 32 | Ntng1 | 18119 | -0.383 | -0.0238 | No |
| 33 | Thy1 | 18642 | -0.435 | 0.0055 | No |
| 34 | Akap7 | 19077 | -0.500 | 0.0475 | No |