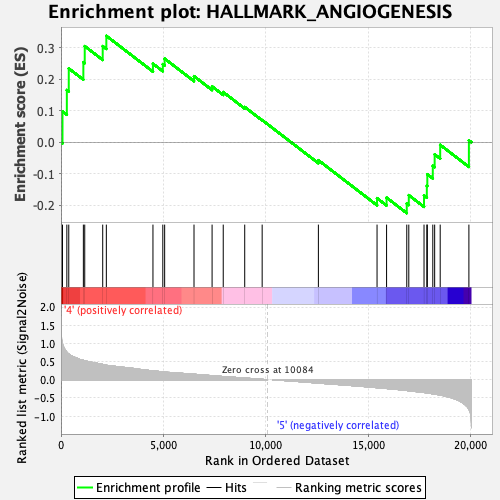
Profile of the Running ES Score & Positions of GeneSet Members on the Rank Ordered List
| Dataset | GMP.GMP.neu_Pheno.cls #Group6_versus_Group8.GMP.neu_Pheno.cls #Group6_versus_Group8_repos |
| Phenotype | GMP.neu_Pheno.cls#Group6_versus_Group8_repos |
| Upregulated in class | 4 |
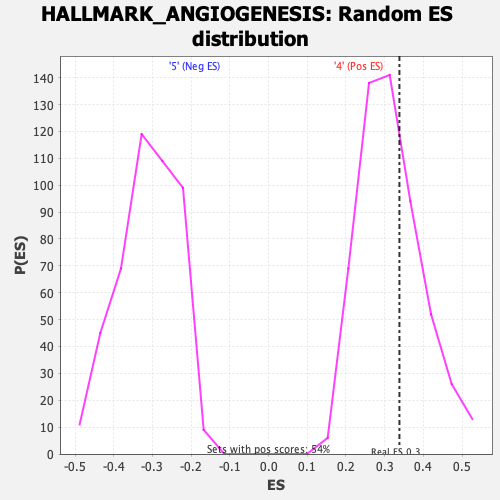
| GeneSet | HALLMARK_ANGIOGENESIS |
| Enrichment Score (ES) | 0.33808205 |
| Normalized Enrichment Score (NES) | 1.0682514 |
| Nominal p-value | 0.3469388 |
| FDR q-value | 0.7601778 |
| FWER p-Value | 0.987 |
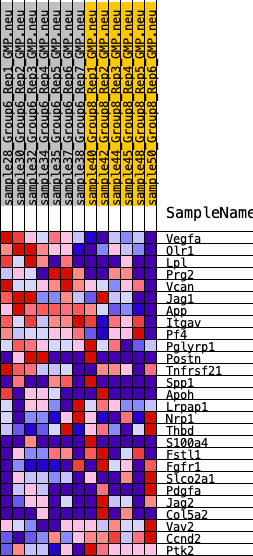
| SYMBOL | RANK IN GENE LIST | RANK METRIC SCORE | RUNNING ES | CORE ENRICHMENT | |
|---|---|---|---|---|---|
| 1 | Vegfa | 73 | 0.978 | 0.0981 | Yes |
| 2 | Olr1 | 285 | 0.754 | 0.1661 | Yes |
| 3 | Lpl | 379 | 0.703 | 0.2346 | Yes |
| 4 | Prg2 | 1091 | 0.533 | 0.2545 | Yes |
| 5 | Vcan | 1158 | 0.521 | 0.3054 | Yes |
| 6 | Jag1 | 2035 | 0.421 | 0.3054 | Yes |
| 7 | App | 2212 | 0.398 | 0.3381 | Yes |
| 8 | Itgav | 4486 | 0.243 | 0.2497 | No |
| 9 | Pf4 | 4967 | 0.217 | 0.2482 | No |
| 10 | Pglyrp1 | 5057 | 0.211 | 0.2657 | No |
| 11 | Postn | 6489 | 0.152 | 0.2100 | No |
| 12 | Tnfrsf21 | 7371 | 0.111 | 0.1775 | No |
| 13 | Spp1 | 7915 | 0.088 | 0.1596 | No |
| 14 | Apoh | 8963 | 0.047 | 0.1121 | No |
| 15 | Lrpap1 | 9814 | 0.011 | 0.0708 | No |
| 16 | Nrp1 | 12557 | -0.091 | -0.0569 | No |
| 17 | Thbd | 15419 | -0.217 | -0.1774 | No |
| 18 | S100a4 | 15884 | -0.240 | -0.1756 | No |
| 19 | Fstl1 | 16869 | -0.295 | -0.1942 | No |
| 20 | Fgfr1 | 16968 | -0.301 | -0.1678 | No |
| 21 | Slco2a1 | 17711 | -0.349 | -0.1686 | No |
| 22 | Pdgfa | 17848 | -0.360 | -0.1380 | No |
| 23 | Jag2 | 17872 | -0.362 | -0.1014 | No |
| 24 | Col5a2 | 18139 | -0.385 | -0.0746 | No |
| 25 | Vav2 | 18230 | -0.393 | -0.0382 | No |
| 26 | Ccnd2 | 18500 | -0.419 | -0.0081 | No |
| 27 | Ptk2 | 19900 | -0.810 | 0.0063 | No |