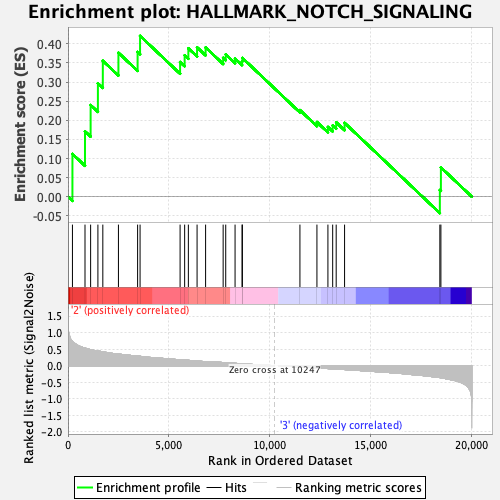
Profile of the Running ES Score & Positions of GeneSet Members on the Rank Ordered List
| Dataset | GMP.GMP.neu_Pheno.cls #Group3_versus_Group4.GMP.neu_Pheno.cls #Group3_versus_Group4_repos |
| Phenotype | GMP.neu_Pheno.cls#Group3_versus_Group4_repos |
| Upregulated in class | 2 |
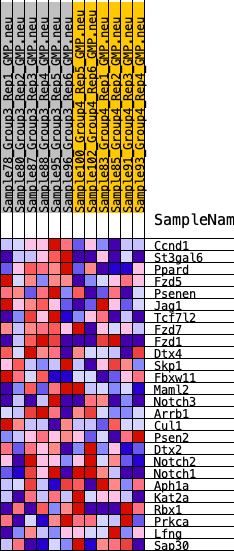
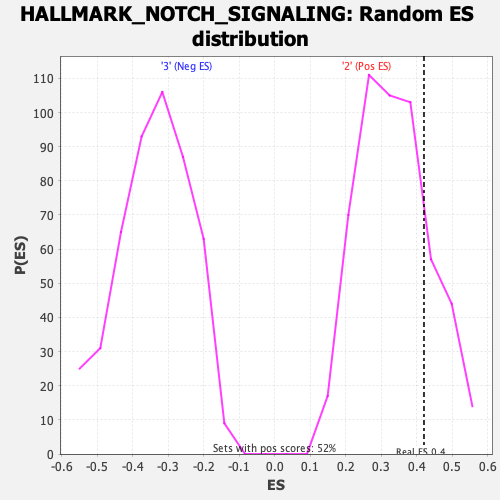
| GeneSet | HALLMARK_NOTCH_SIGNALING |
| Enrichment Score (ES) | 0.42082655 |
| Normalized Enrichment Score (NES) | 1.2555296 |
| Nominal p-value | 0.19001919 |
| FDR q-value | 1.0 |
| FWER p-Value | 0.858 |
| SYMBOL | RANK IN GENE LIST | RANK METRIC SCORE | RUNNING ES | CORE ENRICHMENT | |
|---|---|---|---|---|---|
| 1 | Ccnd1 | 220 | 0.724 | 0.1119 | Yes |
| 2 | St3gal6 | 843 | 0.532 | 0.1711 | Yes |
| 3 | Ppard | 1122 | 0.487 | 0.2399 | Yes |
| 4 | Fzd5 | 1483 | 0.441 | 0.2967 | Yes |
| 5 | Psenen | 1727 | 0.419 | 0.3556 | Yes |
| 6 | Jag1 | 2501 | 0.352 | 0.3767 | Yes |
| 7 | Tcf7l2 | 3452 | 0.292 | 0.3787 | Yes |
| 8 | Fzd7 | 3574 | 0.284 | 0.4208 | Yes |
| 9 | Fzd1 | 5559 | 0.181 | 0.3524 | No |
| 10 | Dtx4 | 5785 | 0.170 | 0.3700 | No |
| 11 | Skp1 | 5969 | 0.162 | 0.3883 | No |
| 12 | Fbxw11 | 6401 | 0.142 | 0.3908 | No |
| 13 | Maml2 | 6824 | 0.123 | 0.3906 | No |
| 14 | Notch3 | 7694 | 0.096 | 0.3633 | No |
| 15 | Arrb1 | 7822 | 0.091 | 0.3723 | No |
| 16 | Cul1 | 8285 | 0.072 | 0.3615 | No |
| 17 | Psen2 | 8632 | 0.058 | 0.3541 | No |
| 18 | Dtx2 | 8648 | 0.057 | 0.3630 | No |
| 19 | Notch2 | 11502 | -0.036 | 0.2266 | No |
| 20 | Notch1 | 12345 | -0.064 | 0.1954 | No |
| 21 | Aph1a | 12890 | -0.085 | 0.1825 | No |
| 22 | Kat2a | 13126 | -0.092 | 0.1865 | No |
| 23 | Rbx1 | 13300 | -0.098 | 0.1945 | No |
| 24 | Prkca | 13716 | -0.114 | 0.1932 | No |
| 25 | Lfng | 18441 | -0.357 | 0.0175 | No |
| 26 | Sap30 | 18493 | -0.363 | 0.0766 | No |