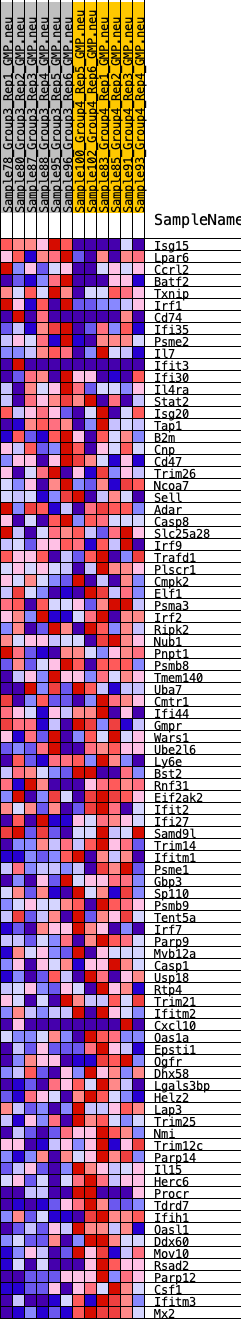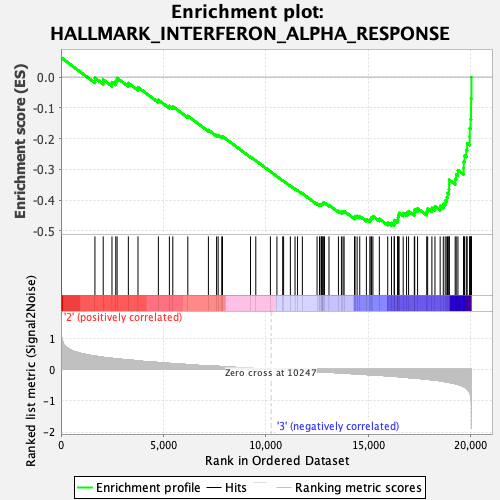
Profile of the Running ES Score & Positions of GeneSet Members on the Rank Ordered List
| Dataset | GMP.GMP.neu_Pheno.cls #Group3_versus_Group4.GMP.neu_Pheno.cls #Group3_versus_Group4_repos |
| Phenotype | GMP.neu_Pheno.cls#Group3_versus_Group4_repos |
| Upregulated in class | 3 |
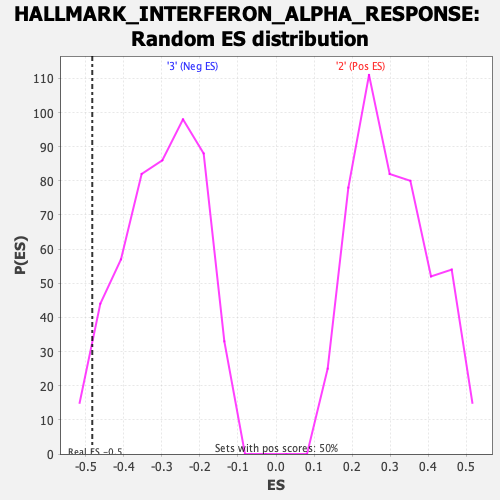
| GeneSet | HALLMARK_INTERFERON_ALPHA_RESPONSE |
| Enrichment Score (ES) | -0.48290038 |
| Normalized Enrichment Score (NES) | -1.6087812 |
| Nominal p-value | 0.035785288 |
| FDR q-value | 0.23611405 |
| FWER p-Value | 0.238 |
| SYMBOL | RANK IN GENE LIST | RANK METRIC SCORE | RUNNING ES | CORE ENRICHMENT | |
|---|---|---|---|---|---|
| 1 | Isg15 | 0 | 1.687 | 0.0638 | No |
| 2 | Lpar6 | 1655 | 0.428 | -0.0030 | No |
| 3 | Ccrl2 | 2059 | 0.387 | -0.0085 | No |
| 4 | Batf2 | 2487 | 0.353 | -0.0166 | No |
| 5 | Txnip | 2672 | 0.339 | -0.0130 | No |
| 6 | Irf1 | 2736 | 0.336 | -0.0035 | No |
| 7 | Cd74 | 3286 | 0.302 | -0.0196 | No |
| 8 | Ifi35 | 3756 | 0.271 | -0.0329 | No |
| 9 | Psme2 | 4750 | 0.218 | -0.0745 | No |
| 10 | Il7 | 5288 | 0.192 | -0.0942 | No |
| 11 | Ifit3 | 5454 | 0.184 | -0.0955 | No |
| 12 | Ifi30 | 6187 | 0.151 | -0.1265 | No |
| 13 | Il4ra | 7191 | 0.115 | -0.1724 | No |
| 14 | Stat2 | 7591 | 0.100 | -0.1887 | No |
| 15 | Isg20 | 7667 | 0.097 | -0.1887 | No |
| 16 | Tap1 | 7843 | 0.089 | -0.1941 | No |
| 17 | B2m | 7879 | 0.088 | -0.1926 | No |
| 18 | Cnp | 9246 | 0.035 | -0.2597 | No |
| 19 | Cd47 | 9503 | 0.027 | -0.2716 | No |
| 20 | Trim26 | 10216 | 0.001 | -0.3072 | No |
| 21 | Ncoa7 | 10534 | -0.003 | -0.3230 | No |
| 22 | Sell | 10815 | -0.013 | -0.3366 | No |
| 23 | Adar | 10860 | -0.015 | -0.3382 | No |
| 24 | Casp8 | 11190 | -0.025 | -0.3538 | No |
| 25 | Slc25a28 | 11418 | -0.034 | -0.3639 | No |
| 26 | Irf9 | 11539 | -0.038 | -0.3685 | No |
| 27 | Trafd1 | 11775 | -0.046 | -0.3785 | No |
| 28 | Plscr1 | 12492 | -0.070 | -0.4118 | No |
| 29 | Cmpk2 | 12611 | -0.074 | -0.4149 | No |
| 30 | Elf1 | 12686 | -0.077 | -0.4157 | No |
| 31 | Psma3 | 12709 | -0.078 | -0.4139 | No |
| 32 | Irf2 | 12739 | -0.079 | -0.4124 | No |
| 33 | Ripk2 | 12775 | -0.080 | -0.4111 | No |
| 34 | Nub1 | 12796 | -0.081 | -0.4090 | No |
| 35 | Pnpt1 | 12857 | -0.083 | -0.4089 | No |
| 36 | Psmb8 | 13074 | -0.090 | -0.4163 | No |
| 37 | Tmem140 | 13535 | -0.107 | -0.4353 | No |
| 38 | Uba7 | 13680 | -0.112 | -0.4383 | No |
| 39 | Cmtr1 | 13757 | -0.116 | -0.4377 | No |
| 40 | Ifi44 | 13811 | -0.118 | -0.4359 | No |
| 41 | Gmpr | 14319 | -0.139 | -0.4561 | No |
| 42 | Wars1 | 14346 | -0.140 | -0.4522 | No |
| 43 | Ube2l6 | 14447 | -0.143 | -0.4518 | No |
| 44 | Ly6e | 14575 | -0.148 | -0.4525 | No |
| 45 | Bst2 | 14899 | -0.162 | -0.4626 | No |
| 46 | Rnf31 | 15068 | -0.169 | -0.4646 | No |
| 47 | Eif2ak2 | 15121 | -0.171 | -0.4608 | No |
| 48 | Ifit2 | 15153 | -0.172 | -0.4559 | No |
| 49 | Ifi27 | 15217 | -0.175 | -0.4524 | No |
| 50 | Samd9l | 15531 | -0.185 | -0.4611 | No |
| 51 | Trim14 | 15940 | -0.206 | -0.4738 | No |
| 52 | Ifitm1 | 16123 | -0.212 | -0.4749 | Yes |
| 53 | Psme1 | 16258 | -0.219 | -0.4733 | Yes |
| 54 | Gbp3 | 16261 | -0.219 | -0.4652 | Yes |
| 55 | Sp110 | 16421 | -0.229 | -0.4645 | Yes |
| 56 | Psmb9 | 16438 | -0.229 | -0.4566 | Yes |
| 57 | Tent5a | 16456 | -0.230 | -0.4488 | Yes |
| 58 | Irf7 | 16495 | -0.232 | -0.4419 | Yes |
| 59 | Parp9 | 16694 | -0.244 | -0.4426 | Yes |
| 60 | Mvb12a | 16859 | -0.253 | -0.4413 | Yes |
| 61 | Casp1 | 16957 | -0.260 | -0.4363 | Yes |
| 62 | Usp18 | 17237 | -0.273 | -0.4400 | Yes |
| 63 | Rtp4 | 17257 | -0.274 | -0.4306 | Yes |
| 64 | Trim21 | 17396 | -0.282 | -0.4269 | Yes |
| 65 | Ifitm2 | 17843 | -0.314 | -0.4374 | Yes |
| 66 | Cxcl10 | 17887 | -0.316 | -0.4276 | Yes |
| 67 | Oas1a | 18095 | -0.330 | -0.4255 | Yes |
| 68 | Epsti1 | 18244 | -0.339 | -0.4201 | Yes |
| 69 | Ogfr | 18498 | -0.364 | -0.4190 | Yes |
| 70 | Dhx58 | 18651 | -0.378 | -0.4123 | Yes |
| 71 | Lgals3bp | 18744 | -0.392 | -0.4021 | Yes |
| 72 | Helz2 | 18824 | -0.402 | -0.3909 | Yes |
| 73 | Lap3 | 18857 | -0.406 | -0.3772 | Yes |
| 74 | Trim25 | 18924 | -0.414 | -0.3649 | Yes |
| 75 | Nmi | 18934 | -0.415 | -0.3496 | Yes |
| 76 | Trim12c | 18936 | -0.415 | -0.3340 | Yes |
| 77 | Parp14 | 19231 | -0.455 | -0.3315 | Yes |
| 78 | Il15 | 19280 | -0.461 | -0.3165 | Yes |
| 79 | Herc6 | 19365 | -0.477 | -0.3027 | Yes |
| 80 | Procr | 19642 | -0.550 | -0.2958 | Yes |
| 81 | Tdrd7 | 19648 | -0.551 | -0.2752 | Yes |
| 82 | Ifih1 | 19688 | -0.566 | -0.2558 | Yes |
| 83 | Oasl1 | 19774 | -0.600 | -0.2374 | Yes |
| 84 | Ddx60 | 19816 | -0.628 | -0.2157 | Yes |
| 85 | Mov10 | 19937 | -0.729 | -0.1941 | Yes |
| 86 | Rsad2 | 19939 | -0.732 | -0.1665 | Yes |
| 87 | Parp12 | 19984 | -0.828 | -0.1374 | Yes |
| 88 | Csf1 | 20004 | -0.905 | -0.1042 | Yes |
| 89 | Ifitm3 | 20006 | -0.913 | -0.0697 | Yes |
| 90 | Mx2 | 20025 | -1.869 | 0.0001 | Yes |