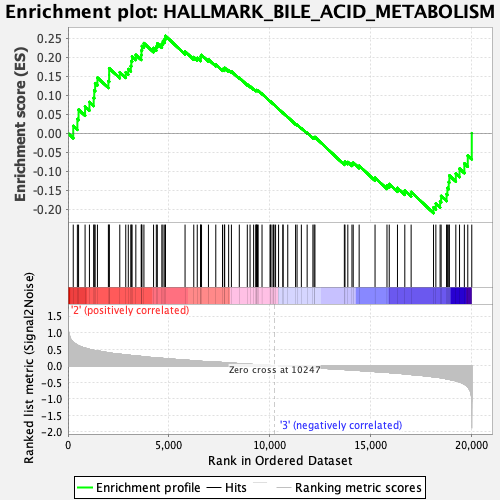
Profile of the Running ES Score & Positions of GeneSet Members on the Rank Ordered List
| Dataset | GMP.GMP.neu_Pheno.cls #Group3_versus_Group4.GMP.neu_Pheno.cls #Group3_versus_Group4_repos |
| Phenotype | GMP.neu_Pheno.cls#Group3_versus_Group4_repos |
| Upregulated in class | 2 |
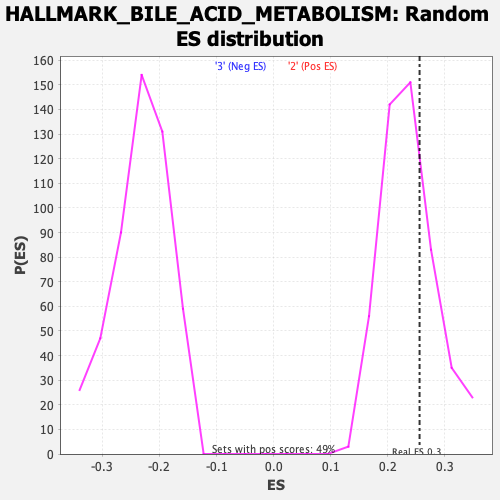
| GeneSet | HALLMARK_BILE_ACID_METABOLISM |
| Enrichment Score (ES) | 0.25562128 |
| Normalized Enrichment Score (NES) | 1.0820905 |
| Nominal p-value | 0.29411766 |
| FDR q-value | 0.687638 |
| FWER p-Value | 0.963 |
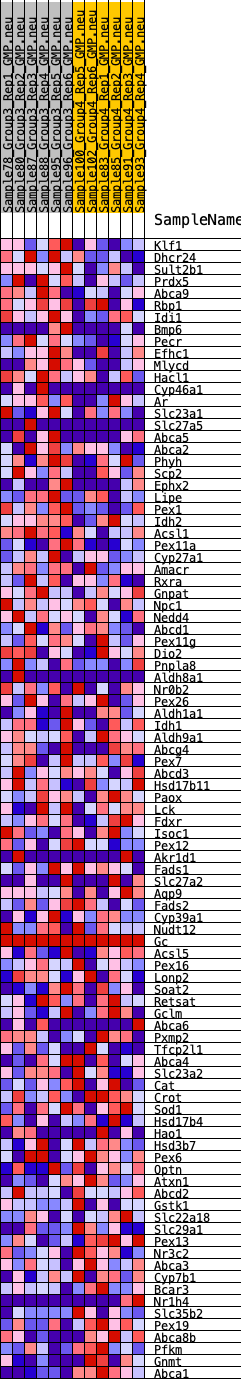
| SYMBOL | RANK IN GENE LIST | RANK METRIC SCORE | RUNNING ES | CORE ENRICHMENT | |
|---|---|---|---|---|---|
| 1 | Klf1 | 260 | 0.703 | 0.0192 | Yes |
| 2 | Dhcr24 | 465 | 0.621 | 0.0374 | Yes |
| 3 | Sult2b1 | 524 | 0.601 | 0.0621 | Yes |
| 4 | Prdx5 | 847 | 0.530 | 0.0702 | Yes |
| 5 | Abca9 | 1063 | 0.493 | 0.0820 | Yes |
| 6 | Rbp1 | 1274 | 0.465 | 0.0928 | Yes |
| 7 | Idi1 | 1302 | 0.461 | 0.1126 | Yes |
| 8 | Bmp6 | 1346 | 0.456 | 0.1314 | Yes |
| 9 | Pecr | 1460 | 0.444 | 0.1461 | Yes |
| 10 | Efhc1 | 2003 | 0.393 | 0.1369 | Yes |
| 11 | Mlycd | 2041 | 0.389 | 0.1528 | Yes |
| 12 | Hacl1 | 2042 | 0.389 | 0.1707 | Yes |
| 13 | Cyp46a1 | 2568 | 0.346 | 0.1602 | Yes |
| 14 | Ar | 2864 | 0.323 | 0.1602 | Yes |
| 15 | Slc23a1 | 2990 | 0.318 | 0.1685 | Yes |
| 16 | Slc27a5 | 3116 | 0.310 | 0.1764 | Yes |
| 17 | Abca5 | 3140 | 0.309 | 0.1894 | Yes |
| 18 | Abca2 | 3178 | 0.306 | 0.2016 | Yes |
| 19 | Phyh | 3364 | 0.296 | 0.2058 | Yes |
| 20 | Scp2 | 3632 | 0.280 | 0.2053 | Yes |
| 21 | Ephx2 | 3643 | 0.279 | 0.2175 | Yes |
| 22 | Lipe | 3667 | 0.277 | 0.2291 | Yes |
| 23 | Pex1 | 3765 | 0.270 | 0.2366 | Yes |
| 24 | Idh2 | 4243 | 0.242 | 0.2237 | Yes |
| 25 | Acsl1 | 4380 | 0.234 | 0.2276 | Yes |
| 26 | Pex11a | 4429 | 0.230 | 0.2358 | Yes |
| 27 | Cyp27a1 | 4655 | 0.224 | 0.2347 | Yes |
| 28 | Amacr | 4711 | 0.220 | 0.2421 | Yes |
| 29 | Rxra | 4798 | 0.215 | 0.2476 | Yes |
| 30 | Gnpat | 4835 | 0.213 | 0.2556 | Yes |
| 31 | Npc1 | 5805 | 0.169 | 0.2147 | No |
| 32 | Nedd4 | 6237 | 0.149 | 0.1999 | No |
| 33 | Abcd1 | 6410 | 0.141 | 0.1978 | No |
| 34 | Pex11g | 6575 | 0.133 | 0.1956 | No |
| 35 | Dio2 | 6577 | 0.133 | 0.2017 | No |
| 36 | Pnpla8 | 6622 | 0.131 | 0.2055 | No |
| 37 | Aldh8a1 | 6965 | 0.119 | 0.1938 | No |
| 38 | Nr0b2 | 7329 | 0.109 | 0.1806 | No |
| 39 | Pex26 | 7662 | 0.097 | 0.1684 | No |
| 40 | Aldh1a1 | 7752 | 0.093 | 0.1682 | No |
| 41 | Idh1 | 7770 | 0.092 | 0.1716 | No |
| 42 | Aldh9a1 | 7967 | 0.085 | 0.1656 | No |
| 43 | Abcg4 | 8104 | 0.079 | 0.1624 | No |
| 44 | Pex7 | 8495 | 0.064 | 0.1458 | No |
| 45 | Abcd3 | 8892 | 0.048 | 0.1281 | No |
| 46 | Hsd17b11 | 9029 | 0.043 | 0.1232 | No |
| 47 | Paox | 9206 | 0.036 | 0.1160 | No |
| 48 | Lck | 9311 | 0.033 | 0.1123 | No |
| 49 | Fdxr | 9339 | 0.032 | 0.1124 | No |
| 50 | Isoc1 | 9349 | 0.032 | 0.1134 | No |
| 51 | Pex12 | 9398 | 0.030 | 0.1124 | No |
| 52 | Akr1d1 | 9430 | 0.029 | 0.1121 | No |
| 53 | Fads1 | 9622 | 0.022 | 0.1036 | No |
| 54 | Slc27a2 | 10019 | 0.009 | 0.0841 | No |
| 55 | Aqp9 | 10046 | 0.007 | 0.0831 | No |
| 56 | Fads2 | 10118 | 0.005 | 0.0798 | No |
| 57 | Cyp39a1 | 10195 | 0.002 | 0.0760 | No |
| 58 | Nudt12 | 10215 | 0.001 | 0.0751 | No |
| 59 | Gc | 10294 | 0.000 | 0.0712 | No |
| 60 | Acsl5 | 10443 | -0.000 | 0.0638 | No |
| 61 | Pex16 | 10656 | -0.007 | 0.0535 | No |
| 62 | Lonp2 | 10667 | -0.007 | 0.0533 | No |
| 63 | Soat2 | 10898 | -0.016 | 0.0425 | No |
| 64 | Retsat | 11286 | -0.029 | 0.0244 | No |
| 65 | Gclm | 11360 | -0.032 | 0.0222 | No |
| 66 | Abca6 | 11573 | -0.039 | 0.0133 | No |
| 67 | Pxmp2 | 11860 | -0.049 | 0.0012 | No |
| 68 | Tfcp2l1 | 12146 | -0.058 | -0.0104 | No |
| 69 | Abca4 | 12205 | -0.060 | -0.0106 | No |
| 70 | Slc23a2 | 12246 | -0.061 | -0.0098 | No |
| 71 | Cat | 13705 | -0.114 | -0.0778 | No |
| 72 | Crot | 13736 | -0.115 | -0.0740 | No |
| 73 | Sod1 | 13877 | -0.120 | -0.0755 | No |
| 74 | Hsd17b4 | 14082 | -0.128 | -0.0799 | No |
| 75 | Hao1 | 14144 | -0.131 | -0.0769 | No |
| 76 | Hsd3b7 | 14439 | -0.142 | -0.0851 | No |
| 77 | Pex6 | 15227 | -0.176 | -0.1165 | No |
| 78 | Optn | 15819 | -0.200 | -0.1370 | No |
| 79 | Atxn1 | 15931 | -0.205 | -0.1332 | No |
| 80 | Abcd2 | 16339 | -0.223 | -0.1434 | No |
| 81 | Gstk1 | 16703 | -0.244 | -0.1504 | No |
| 82 | Slc22a18 | 17017 | -0.264 | -0.1540 | No |
| 83 | Slc29a1 | 18127 | -0.333 | -0.1944 | No |
| 84 | Pex13 | 18243 | -0.339 | -0.1846 | No |
| 85 | Nr3c2 | 18453 | -0.358 | -0.1787 | No |
| 86 | Abca3 | 18504 | -0.365 | -0.1645 | No |
| 87 | Cyp7b1 | 18773 | -0.395 | -0.1598 | No |
| 88 | Bcar3 | 18815 | -0.400 | -0.1435 | No |
| 89 | Nr1h4 | 18882 | -0.408 | -0.1281 | No |
| 90 | Slc35b2 | 18913 | -0.412 | -0.1107 | No |
| 91 | Pex19 | 19233 | -0.455 | -0.1059 | No |
| 92 | Abca8b | 19417 | -0.488 | -0.0927 | No |
| 93 | Pfkm | 19656 | -0.554 | -0.0792 | No |
| 94 | Gnmt | 19826 | -0.631 | -0.0588 | No |
| 95 | Abca1 | 20024 | -1.500 | 0.0001 | No |