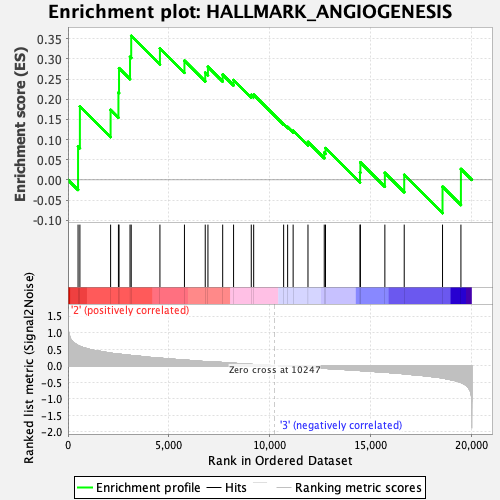
Profile of the Running ES Score & Positions of GeneSet Members on the Rank Ordered List
| Dataset | GMP.GMP.neu_Pheno.cls #Group3_versus_Group4.GMP.neu_Pheno.cls #Group3_versus_Group4_repos |
| Phenotype | GMP.neu_Pheno.cls#Group3_versus_Group4_repos |
| Upregulated in class | 2 |
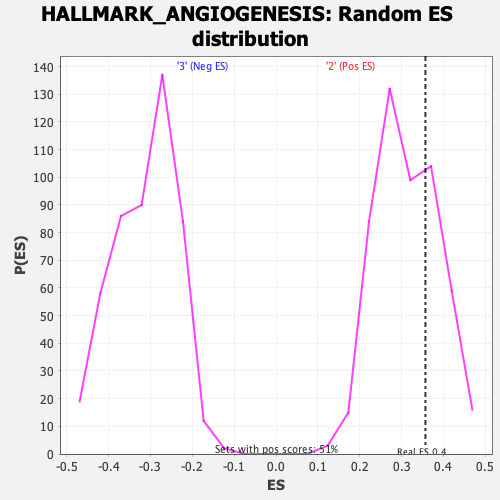
| GeneSet | HALLMARK_ANGIOGENESIS |
| Enrichment Score (ES) | 0.35698658 |
| Normalized Enrichment Score (NES) | 1.1479576 |
| Nominal p-value | 0.28125 |
| FDR q-value | 0.6996429 |
| FWER p-Value | 0.93 |
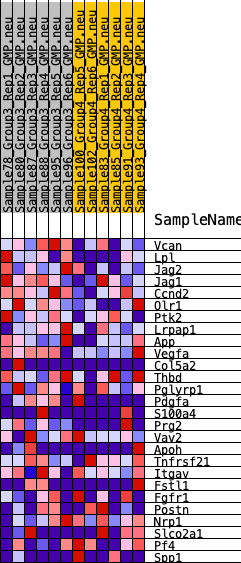
| SYMBOL | RANK IN GENE LIST | RANK METRIC SCORE | RUNNING ES | CORE ENRICHMENT | |
|---|---|---|---|---|---|
| 1 | Vcan | 499 | 0.609 | 0.0830 | Yes |
| 2 | Lpl | 590 | 0.585 | 0.1822 | Yes |
| 3 | Jag2 | 2113 | 0.380 | 0.1735 | Yes |
| 4 | Jag1 | 2501 | 0.352 | 0.2164 | Yes |
| 5 | Ccnd2 | 2531 | 0.349 | 0.2768 | Yes |
| 6 | Olr1 | 3076 | 0.313 | 0.3051 | Yes |
| 7 | Ptk2 | 3135 | 0.309 | 0.3570 | Yes |
| 8 | Lrpap1 | 4559 | 0.228 | 0.3262 | No |
| 9 | App | 5775 | 0.170 | 0.2956 | No |
| 10 | Vegfa | 6806 | 0.123 | 0.2659 | No |
| 11 | Col5a2 | 6940 | 0.119 | 0.2804 | No |
| 12 | Thbd | 7671 | 0.097 | 0.2610 | No |
| 13 | Pglyrp1 | 8211 | 0.075 | 0.2474 | No |
| 14 | Pdgfa | 9089 | 0.040 | 0.2108 | No |
| 15 | S100a4 | 9208 | 0.036 | 0.2112 | No |
| 16 | Prg2 | 10694 | -0.008 | 0.1384 | No |
| 17 | Vav2 | 10892 | -0.015 | 0.1312 | No |
| 18 | Apoh | 11165 | -0.024 | 0.1220 | No |
| 19 | Tnfrsf21 | 11901 | -0.050 | 0.0941 | No |
| 20 | Itgav | 12708 | -0.078 | 0.0676 | No |
| 21 | Fstl1 | 12770 | -0.080 | 0.0787 | No |
| 22 | Fgfr1 | 14480 | -0.144 | 0.0189 | No |
| 23 | Postn | 14501 | -0.145 | 0.0436 | No |
| 24 | Nrp1 | 15714 | -0.194 | 0.0174 | No |
| 25 | Slco2a1 | 16674 | -0.243 | 0.0124 | No |
| 26 | Pf4 | 18574 | -0.370 | -0.0169 | No |
| 27 | Spp1 | 19486 | -0.505 | 0.0270 | No |