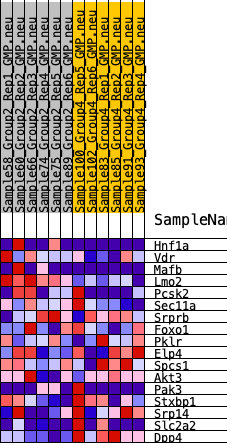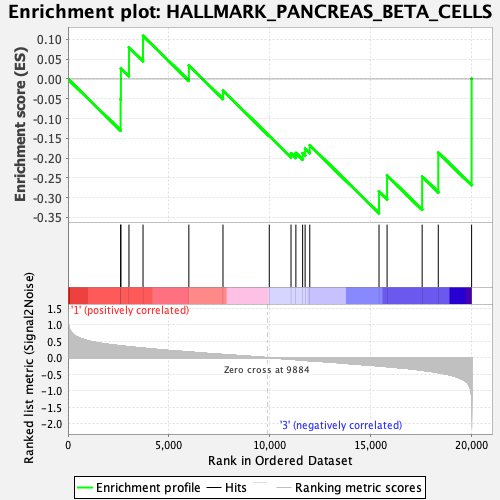
Profile of the Running ES Score & Positions of GeneSet Members on the Rank Ordered List
| Dataset | GMP.GMP.neu_Pheno.cls #Group2_versus_Group4.GMP.neu_Pheno.cls #Group2_versus_Group4_repos |
| Phenotype | GMP.neu_Pheno.cls#Group2_versus_Group4_repos |
| Upregulated in class | 3 |
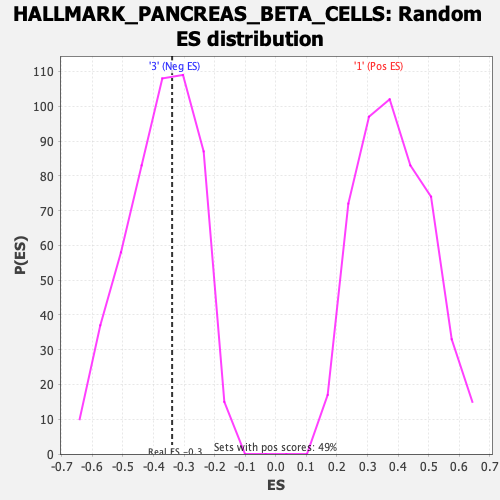
| GeneSet | HALLMARK_PANCREAS_BETA_CELLS |
| Enrichment Score (ES) | -0.3392444 |
| Normalized Enrichment Score (NES) | -0.9101833 |
| Nominal p-value | 0.57988167 |
| FDR q-value | 1.0 |
| FWER p-Value | 0.995 |
| SYMBOL | RANK IN GENE LIST | RANK METRIC SCORE | RUNNING ES | CORE ENRICHMENT | |
|---|---|---|---|---|---|
| 1 | Hnf1a | 2609 | 0.355 | -0.0513 | No |
| 2 | Vdr | 2624 | 0.354 | 0.0268 | No |
| 3 | Mafb | 3023 | 0.328 | 0.0798 | No |
| 4 | Lmo2 | 3721 | 0.288 | 0.1090 | No |
| 5 | Pcsk2 | 5993 | 0.172 | 0.0338 | No |
| 6 | Sec11a | 7686 | 0.094 | -0.0297 | No |
| 7 | Srprb | 9982 | -0.001 | -0.1441 | No |
| 8 | Foxo1 | 11060 | -0.046 | -0.1878 | No |
| 9 | Pklr | 11301 | -0.057 | -0.1871 | No |
| 10 | Elp4 | 11636 | -0.073 | -0.1875 | No |
| 11 | Spcs1 | 11759 | -0.078 | -0.1762 | No |
| 12 | Akt3 | 11990 | -0.090 | -0.1677 | No |
| 13 | Pak3 | 15424 | -0.247 | -0.2842 | Yes |
| 14 | Stxbp1 | 15824 | -0.270 | -0.2441 | Yes |
| 15 | Srp14 | 17563 | -0.379 | -0.2466 | Yes |
| 16 | Slc2a2 | 18363 | -0.451 | -0.1861 | Yes |
| 17 | Dpp4 | 20016 | -1.210 | 0.0005 | Yes |