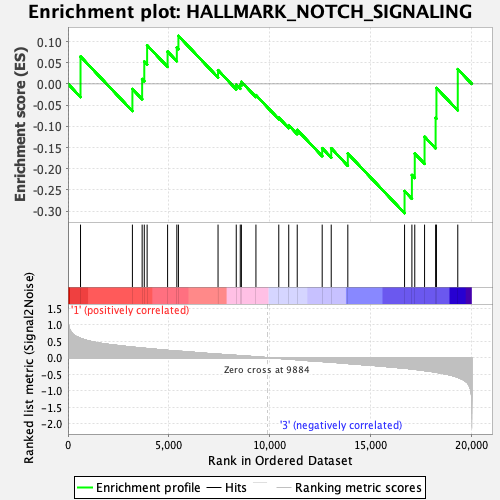
Profile of the Running ES Score & Positions of GeneSet Members on the Rank Ordered List
| Dataset | GMP.GMP.neu_Pheno.cls #Group2_versus_Group4.GMP.neu_Pheno.cls #Group2_versus_Group4_repos |
| Phenotype | GMP.neu_Pheno.cls#Group2_versus_Group4_repos |
| Upregulated in class | 3 |
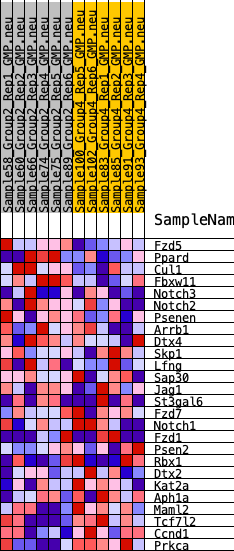
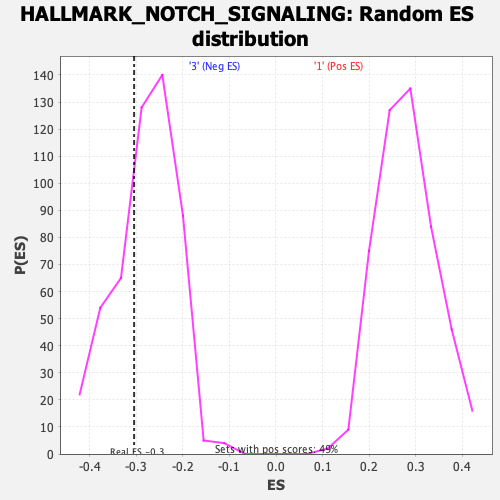
| GeneSet | HALLMARK_NOTCH_SIGNALING |
| Enrichment Score (ES) | -0.3048662 |
| Normalized Enrichment Score (NES) | -1.0893348 |
| Nominal p-value | 0.31620553 |
| FDR q-value | 0.8026067 |
| FWER p-Value | 0.954 |
| SYMBOL | RANK IN GENE LIST | RANK METRIC SCORE | RUNNING ES | CORE ENRICHMENT | |
|---|---|---|---|---|---|
| 1 | Fzd5 | 621 | 0.583 | 0.0646 | No |
| 2 | Ppard | 3194 | 0.317 | -0.0120 | No |
| 3 | Cul1 | 3677 | 0.290 | 0.0115 | No |
| 4 | Fbxw11 | 3783 | 0.284 | 0.0528 | No |
| 5 | Notch3 | 3924 | 0.275 | 0.0909 | No |
| 6 | Notch2 | 4939 | 0.220 | 0.0763 | No |
| 7 | Psenen | 5397 | 0.196 | 0.0857 | No |
| 8 | Arrb1 | 5476 | 0.192 | 0.1133 | No |
| 9 | Dtx4 | 7441 | 0.105 | 0.0323 | No |
| 10 | Skp1 | 8344 | 0.068 | -0.0017 | No |
| 11 | Lfng | 8543 | 0.060 | -0.0017 | No |
| 12 | Sap30 | 8599 | 0.058 | 0.0050 | No |
| 13 | Jag1 | 9320 | 0.027 | -0.0266 | No |
| 14 | St3gal6 | 10453 | -0.021 | -0.0797 | No |
| 15 | Fzd7 | 10947 | -0.042 | -0.0975 | No |
| 16 | Notch1 | 11368 | -0.060 | -0.1086 | No |
| 17 | Fzd1 | 12606 | -0.115 | -0.1517 | No |
| 18 | Psen2 | 13054 | -0.135 | -0.1519 | No |
| 19 | Rbx1 | 13877 | -0.175 | -0.1642 | No |
| 20 | Dtx2 | 16691 | -0.318 | -0.2527 | Yes |
| 21 | Kat2a | 17055 | -0.341 | -0.2149 | Yes |
| 22 | Aph1a | 17197 | -0.351 | -0.1643 | Yes |
| 23 | Maml2 | 17683 | -0.389 | -0.1247 | Yes |
| 24 | Tcf7l2 | 18231 | -0.438 | -0.0801 | Yes |
| 25 | Ccnd1 | 18272 | -0.442 | -0.0096 | Yes |
| 26 | Prkca | 19330 | -0.593 | 0.0348 | Yes |