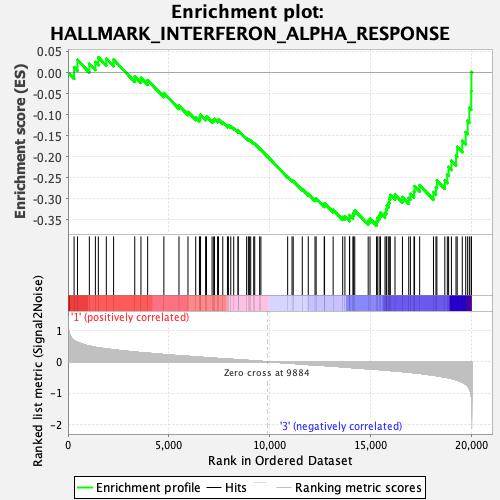
Profile of the Running ES Score & Positions of GeneSet Members on the Rank Ordered List
| Dataset | GMP.GMP.neu_Pheno.cls #Group2_versus_Group4.GMP.neu_Pheno.cls #Group2_versus_Group4_repos |
| Phenotype | GMP.neu_Pheno.cls#Group2_versus_Group4_repos |
| Upregulated in class | 3 |
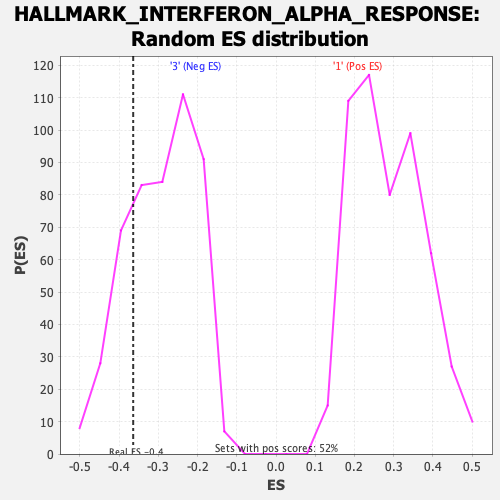
| GeneSet | HALLMARK_INTERFERON_ALPHA_RESPONSE |
| Enrichment Score (ES) | -0.3640274 |
| Normalized Enrichment Score (NES) | -1.2470983 |
| Nominal p-value | 0.22869022 |
| FDR q-value | 1.0 |
| FWER p-Value | 0.828 |
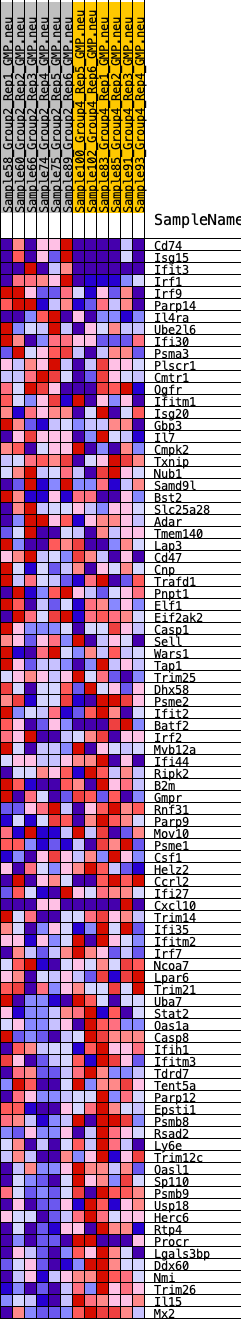
| SYMBOL | RANK IN GENE LIST | RANK METRIC SCORE | RUNNING ES | CORE ENRICHMENT | |
|---|---|---|---|---|---|
| 1 | Cd74 | 302 | 0.681 | 0.0128 | No |
| 2 | Isg15 | 470 | 0.623 | 0.0299 | No |
| 3 | Ifit3 | 1059 | 0.501 | 0.0209 | No |
| 4 | Irf1 | 1358 | 0.463 | 0.0249 | No |
| 5 | Irf9 | 1505 | 0.446 | 0.0359 | No |
| 6 | Parp14 | 1900 | 0.410 | 0.0329 | No |
| 7 | Il4ra | 2261 | 0.382 | 0.0305 | No |
| 8 | Ube2l6 | 3310 | 0.311 | -0.0093 | No |
| 9 | Ifi30 | 3618 | 0.292 | -0.0128 | No |
| 10 | Psma3 | 3950 | 0.274 | -0.0182 | No |
| 11 | Plscr1 | 4754 | 0.231 | -0.0490 | No |
| 12 | Cmtr1 | 5504 | 0.190 | -0.0788 | No |
| 13 | Ogfr | 5950 | 0.173 | -0.0940 | No |
| 14 | Ifitm1 | 6333 | 0.155 | -0.1068 | No |
| 15 | Isg20 | 6519 | 0.149 | -0.1100 | No |
| 16 | Gbp3 | 6548 | 0.147 | -0.1053 | No |
| 17 | Il7 | 6574 | 0.146 | -0.1006 | No |
| 18 | Cmpk2 | 6824 | 0.132 | -0.1077 | No |
| 19 | Txnip | 6869 | 0.129 | -0.1046 | No |
| 20 | Nub1 | 7145 | 0.116 | -0.1137 | No |
| 21 | Samd9l | 7225 | 0.113 | -0.1130 | No |
| 22 | Bst2 | 7266 | 0.110 | -0.1105 | No |
| 23 | Slc25a28 | 7418 | 0.106 | -0.1137 | No |
| 24 | Adar | 7465 | 0.104 | -0.1118 | No |
| 25 | Tmem140 | 7675 | 0.095 | -0.1184 | No |
| 26 | Lap3 | 7908 | 0.088 | -0.1264 | No |
| 27 | Cd47 | 7956 | 0.086 | -0.1253 | No |
| 28 | Cnp | 8072 | 0.080 | -0.1278 | No |
| 29 | Trafd1 | 8218 | 0.074 | -0.1320 | No |
| 30 | Pnpt1 | 8435 | 0.064 | -0.1402 | No |
| 31 | Elf1 | 8436 | 0.064 | -0.1376 | No |
| 32 | Eif2ak2 | 8858 | 0.046 | -0.1568 | No |
| 33 | Casp1 | 8945 | 0.042 | -0.1594 | No |
| 34 | Sell | 8995 | 0.040 | -0.1602 | No |
| 35 | Wars1 | 9060 | 0.038 | -0.1619 | No |
| 36 | Tap1 | 9210 | 0.031 | -0.1681 | No |
| 37 | Trim25 | 9260 | 0.030 | -0.1693 | No |
| 38 | Dhx58 | 9504 | 0.018 | -0.1808 | No |
| 39 | Psme2 | 9566 | 0.015 | -0.1832 | No |
| 40 | Ifit2 | 10893 | -0.039 | -0.2482 | No |
| 41 | Batf2 | 11110 | -0.048 | -0.2571 | No |
| 42 | Irf2 | 11169 | -0.051 | -0.2579 | No |
| 43 | Mvb12a | 11619 | -0.072 | -0.2775 | No |
| 44 | Ifi44 | 11916 | -0.087 | -0.2887 | No |
| 45 | Ripk2 | 12250 | -0.102 | -0.3013 | No |
| 46 | B2m | 12305 | -0.104 | -0.2997 | No |
| 47 | Gmpr | 12706 | -0.119 | -0.3149 | No |
| 48 | Rnf31 | 12723 | -0.120 | -0.3108 | No |
| 49 | Parp9 | 13149 | -0.139 | -0.3264 | No |
| 50 | Mov10 | 13623 | -0.162 | -0.3435 | No |
| 51 | Psme1 | 13733 | -0.167 | -0.3421 | No |
| 52 | Csf1 | 13959 | -0.179 | -0.3461 | No |
| 53 | Helz2 | 13968 | -0.179 | -0.3391 | No |
| 54 | Ccrl2 | 14129 | -0.187 | -0.3395 | No |
| 55 | Ifi27 | 14166 | -0.189 | -0.3336 | No |
| 56 | Cxcl10 | 14221 | -0.191 | -0.3284 | No |
| 57 | Trim14 | 14887 | -0.224 | -0.3526 | No |
| 58 | Ifi35 | 14978 | -0.228 | -0.3478 | No |
| 59 | Ifitm2 | 15303 | -0.242 | -0.3541 | Yes |
| 60 | Irf7 | 15339 | -0.243 | -0.3459 | Yes |
| 61 | Ncoa7 | 15432 | -0.248 | -0.3404 | Yes |
| 62 | Lpar6 | 15498 | -0.251 | -0.3334 | Yes |
| 63 | Trim21 | 15722 | -0.263 | -0.3338 | Yes |
| 64 | Uba7 | 15781 | -0.267 | -0.3258 | Yes |
| 65 | Stat2 | 15809 | -0.269 | -0.3161 | Yes |
| 66 | Oas1a | 15905 | -0.273 | -0.3097 | Yes |
| 67 | Casp8 | 15932 | -0.275 | -0.2997 | Yes |
| 68 | Ifih1 | 15985 | -0.279 | -0.2909 | Yes |
| 69 | Ifitm3 | 16217 | -0.291 | -0.2906 | Yes |
| 70 | Tdrd7 | 16586 | -0.311 | -0.2963 | Yes |
| 71 | Tent5a | 16898 | -0.330 | -0.2984 | Yes |
| 72 | Parp12 | 16981 | -0.336 | -0.2887 | Yes |
| 73 | Epsti1 | 17158 | -0.348 | -0.2833 | Yes |
| 74 | Psmb8 | 17186 | -0.351 | -0.2703 | Yes |
| 75 | Rsad2 | 17440 | -0.367 | -0.2679 | Yes |
| 76 | Ly6e | 18125 | -0.428 | -0.2847 | Yes |
| 77 | Trim12c | 18247 | -0.440 | -0.2728 | Yes |
| 78 | Oasl1 | 18294 | -0.445 | -0.2569 | Yes |
| 79 | Sp110 | 18687 | -0.485 | -0.2567 | Yes |
| 80 | Psmb9 | 18812 | -0.500 | -0.2424 | Yes |
| 81 | Usp18 | 18876 | -0.511 | -0.2247 | Yes |
| 82 | Herc6 | 19015 | -0.532 | -0.2098 | Yes |
| 83 | Rtp4 | 19242 | -0.573 | -0.1977 | Yes |
| 84 | Procr | 19301 | -0.586 | -0.1766 | Yes |
| 85 | Lgals3bp | 19553 | -0.651 | -0.1625 | Yes |
| 86 | Ddx60 | 19723 | -0.715 | -0.1417 | Yes |
| 87 | Nmi | 19819 | -0.771 | -0.1149 | Yes |
| 88 | Trim26 | 19906 | -0.865 | -0.0838 | Yes |
| 89 | Il15 | 19997 | -1.073 | -0.0444 | Yes |
| 90 | Mx2 | 20005 | -1.117 | 0.0011 | Yes |