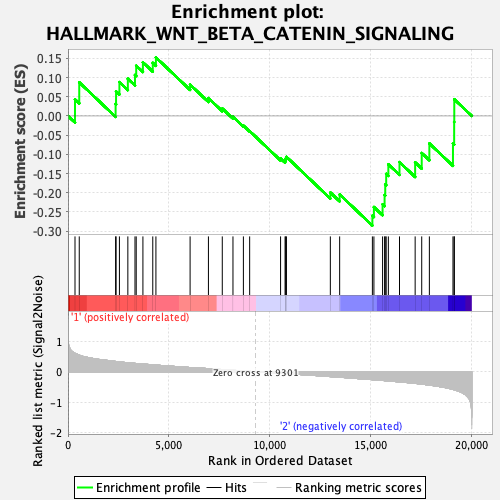
Profile of the Running ES Score & Positions of GeneSet Members on the Rank Ordered List
| Dataset | GMP.GMP.neu_Pheno.cls #Group2_versus_Group3.GMP.neu_Pheno.cls #Group2_versus_Group3_repos |
| Phenotype | GMP.neu_Pheno.cls#Group2_versus_Group3_repos |
| Upregulated in class | 2 |
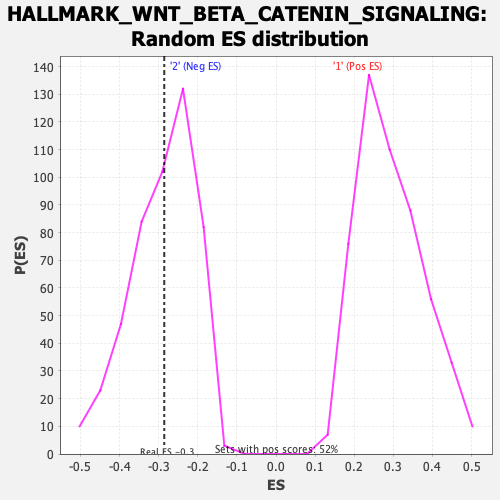
| GeneSet | HALLMARK_WNT_BETA_CATENIN_SIGNALING |
| Enrichment Score (ES) | -0.28575763 |
| Normalized Enrichment Score (NES) | -0.9882908 |
| Nominal p-value | 0.49275362 |
| FDR q-value | 0.8563292 |
| FWER p-Value | 0.989 |
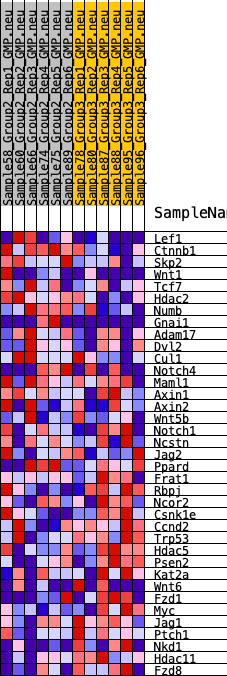
| SYMBOL | RANK IN GENE LIST | RANK METRIC SCORE | RUNNING ES | CORE ENRICHMENT | |
|---|---|---|---|---|---|
| 1 | Lef1 | 347 | 0.601 | 0.0433 | No |
| 2 | Ctnnb1 | 558 | 0.544 | 0.0876 | No |
| 3 | Skp2 | 2361 | 0.336 | 0.0314 | No |
| 4 | Wnt1 | 2384 | 0.334 | 0.0640 | No |
| 5 | Tcf7 | 2550 | 0.321 | 0.0882 | No |
| 6 | Hdac2 | 2968 | 0.294 | 0.0970 | No |
| 7 | Numb | 3322 | 0.273 | 0.1069 | No |
| 8 | Gnai1 | 3383 | 0.270 | 0.1311 | No |
| 9 | Adam17 | 3715 | 0.252 | 0.1399 | No |
| 10 | Dvl2 | 4204 | 0.226 | 0.1383 | No |
| 11 | Cul1 | 4360 | 0.218 | 0.1526 | No |
| 12 | Notch4 | 6055 | 0.138 | 0.0817 | No |
| 13 | Maml1 | 6964 | 0.102 | 0.0466 | No |
| 14 | Axin1 | 7651 | 0.072 | 0.0195 | No |
| 15 | Axin2 | 8181 | 0.050 | -0.0020 | No |
| 16 | Wnt5b | 8698 | 0.026 | -0.0251 | No |
| 17 | Notch1 | 9009 | 0.012 | -0.0394 | No |
| 18 | Ncstn | 10542 | -0.052 | -0.1108 | No |
| 19 | Jag2 | 10765 | -0.060 | -0.1158 | No |
| 20 | Ppard | 10793 | -0.062 | -0.1110 | No |
| 21 | Frat1 | 10833 | -0.063 | -0.1065 | No |
| 22 | Rbpj | 13010 | -0.157 | -0.1995 | No |
| 23 | Ncor2 | 13472 | -0.178 | -0.2046 | No |
| 24 | Csnk1e | 15095 | -0.257 | -0.2598 | Yes |
| 25 | Ccnd2 | 15171 | -0.260 | -0.2374 | Yes |
| 26 | Trp53 | 15601 | -0.283 | -0.2302 | Yes |
| 27 | Hdac5 | 15701 | -0.289 | -0.2060 | Yes |
| 28 | Psen2 | 15733 | -0.291 | -0.1783 | Yes |
| 29 | Kat2a | 15780 | -0.293 | -0.1510 | Yes |
| 30 | Wnt6 | 15887 | -0.300 | -0.1260 | Yes |
| 31 | Fzd1 | 16440 | -0.330 | -0.1203 | Yes |
| 32 | Myc | 17216 | -0.379 | -0.1209 | Yes |
| 33 | Jag1 | 17542 | -0.402 | -0.0966 | Yes |
| 34 | Ptch1 | 17921 | -0.436 | -0.0716 | Yes |
| 35 | Nkd1 | 19092 | -0.576 | -0.0720 | Yes |
| 36 | Hdac11 | 19151 | -0.587 | -0.0157 | Yes |
| 37 | Fzd8 | 19157 | -0.589 | 0.0435 | Yes |