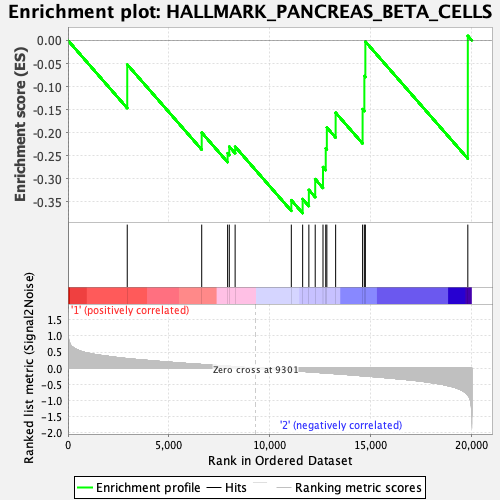
Profile of the Running ES Score & Positions of GeneSet Members on the Rank Ordered List
| Dataset | GMP.GMP.neu_Pheno.cls #Group2_versus_Group3.GMP.neu_Pheno.cls #Group2_versus_Group3_repos |
| Phenotype | GMP.neu_Pheno.cls#Group2_versus_Group3_repos |
| Upregulated in class | 2 |
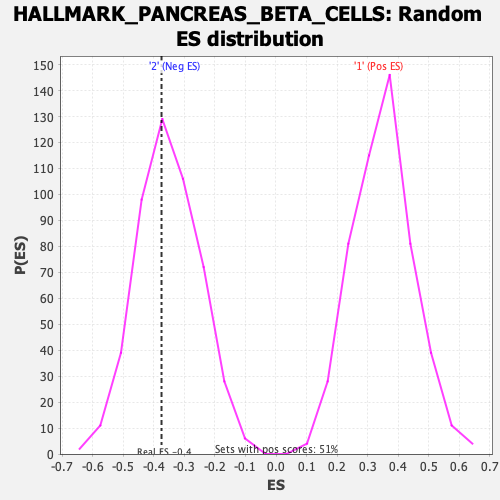
| GeneSet | HALLMARK_PANCREAS_BETA_CELLS |
| Enrichment Score (ES) | -0.3745808 |
| Normalized Enrichment Score (NES) | -1.0656759 |
| Nominal p-value | 0.41344196 |
| FDR q-value | 1.0 |
| FWER p-Value | 0.973 |
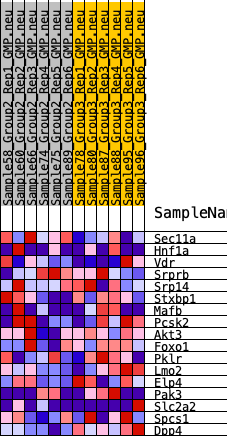
| SYMBOL | RANK IN GENE LIST | RANK METRIC SCORE | RUNNING ES | CORE ENRICHMENT | |
|---|---|---|---|---|---|
| 1 | Sec11a | 2938 | 0.295 | -0.0523 | No |
| 2 | Hnf1a | 6631 | 0.115 | -0.1999 | No |
| 3 | Vdr | 7916 | 0.061 | -0.2446 | No |
| 4 | Srprb | 7999 | 0.058 | -0.2302 | No |
| 5 | Srp14 | 8288 | 0.044 | -0.2304 | No |
| 6 | Stxbp1 | 11075 | -0.072 | -0.3465 | Yes |
| 7 | Mafb | 11637 | -0.096 | -0.3440 | Yes |
| 8 | Pcsk2 | 11945 | -0.110 | -0.3242 | Yes |
| 9 | Akt3 | 12260 | -0.122 | -0.3008 | Yes |
| 10 | Foxo1 | 12646 | -0.142 | -0.2746 | Yes |
| 11 | Pklr | 12782 | -0.147 | -0.2341 | Yes |
| 12 | Lmo2 | 12837 | -0.149 | -0.1889 | Yes |
| 13 | Elp4 | 13273 | -0.168 | -0.1567 | Yes |
| 14 | Pak3 | 14610 | -0.232 | -0.1490 | Yes |
| 15 | Slc2a2 | 14697 | -0.238 | -0.0771 | Yes |
| 16 | Spcs1 | 14747 | -0.240 | -0.0024 | Yes |
| 17 | Dpp4 | 19828 | -0.830 | 0.0099 | Yes |