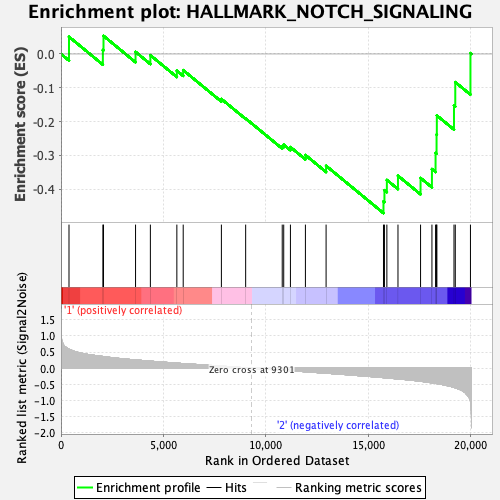
Profile of the Running ES Score & Positions of GeneSet Members on the Rank Ordered List
| Dataset | GMP.GMP.neu_Pheno.cls #Group2_versus_Group3.GMP.neu_Pheno.cls #Group2_versus_Group3_repos |
| Phenotype | GMP.neu_Pheno.cls#Group2_versus_Group3_repos |
| Upregulated in class | 2 |
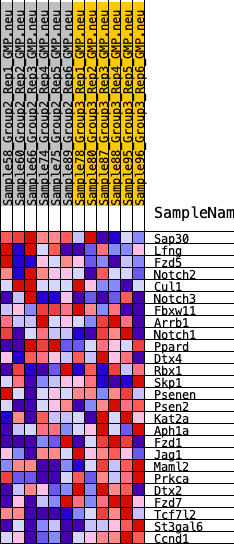
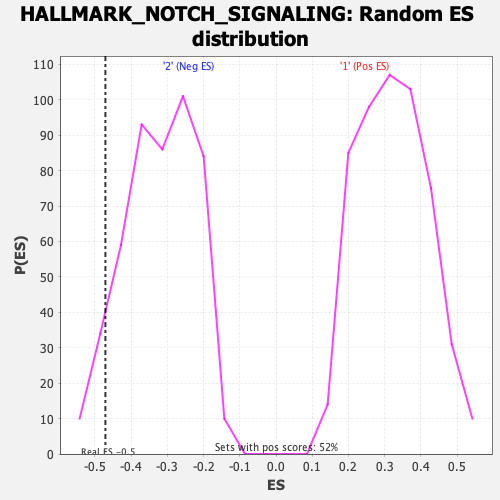
| GeneSet | HALLMARK_NOTCH_SIGNALING |
| Enrichment Score (ES) | -0.47066867 |
| Normalized Enrichment Score (NES) | -1.4680439 |
| Nominal p-value | 0.054507338 |
| FDR q-value | 0.5075845 |
| FWER p-Value | 0.492 |
| SYMBOL | RANK IN GENE LIST | RANK METRIC SCORE | RUNNING ES | CORE ENRICHMENT | |
|---|---|---|---|---|---|
| 1 | Sap30 | 390 | 0.586 | 0.0509 | No |
| 2 | Lfng | 2043 | 0.362 | 0.0119 | No |
| 3 | Fzd5 | 2074 | 0.360 | 0.0535 | No |
| 4 | Notch2 | 3637 | 0.256 | 0.0062 | No |
| 5 | Cul1 | 4360 | 0.218 | -0.0037 | No |
| 6 | Notch3 | 5652 | 0.156 | -0.0494 | No |
| 7 | Fbxw11 | 5962 | 0.142 | -0.0478 | No |
| 8 | Arrb1 | 7825 | 0.065 | -0.1331 | No |
| 9 | Notch1 | 9009 | 0.012 | -0.1908 | No |
| 10 | Ppard | 10793 | -0.062 | -0.2725 | No |
| 11 | Dtx4 | 10866 | -0.065 | -0.2683 | No |
| 12 | Rbx1 | 11193 | -0.077 | -0.2754 | No |
| 13 | Skp1 | 11924 | -0.109 | -0.2988 | No |
| 14 | Psenen | 12933 | -0.154 | -0.3307 | No |
| 15 | Psen2 | 15733 | -0.291 | -0.4358 | Yes |
| 16 | Kat2a | 15780 | -0.293 | -0.4028 | Yes |
| 17 | Aph1a | 15898 | -0.300 | -0.3726 | Yes |
| 18 | Fzd1 | 16440 | -0.330 | -0.3600 | Yes |
| 19 | Jag1 | 17542 | -0.402 | -0.3668 | Yes |
| 20 | Maml2 | 18097 | -0.451 | -0.3403 | Yes |
| 21 | Prkca | 18274 | -0.469 | -0.2928 | Yes |
| 22 | Dtx2 | 18323 | -0.474 | -0.2382 | Yes |
| 23 | Fzd7 | 18336 | -0.475 | -0.1818 | Yes |
| 24 | Tcf7l2 | 19173 | -0.591 | -0.1526 | Yes |
| 25 | St3gal6 | 19236 | -0.603 | -0.0833 | Yes |
| 26 | Ccnd1 | 19976 | -1.022 | 0.0025 | Yes |