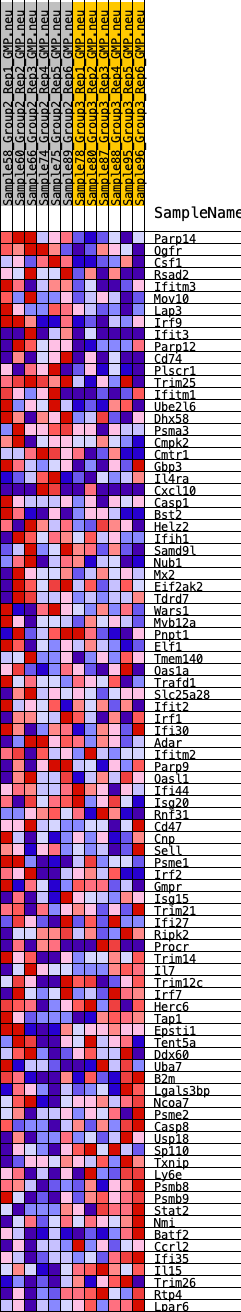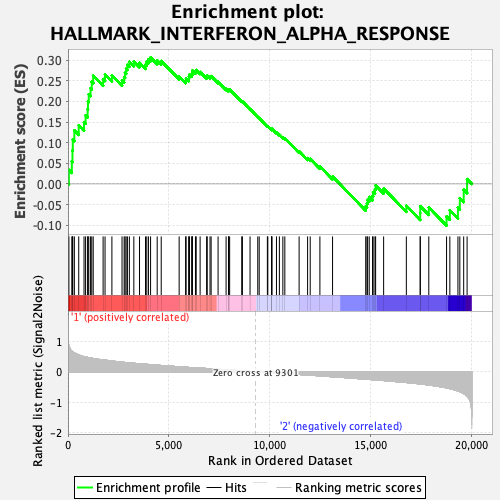
Profile of the Running ES Score & Positions of GeneSet Members on the Rank Ordered List
| Dataset | GMP.GMP.neu_Pheno.cls #Group2_versus_Group3.GMP.neu_Pheno.cls #Group2_versus_Group3_repos |
| Phenotype | GMP.neu_Pheno.cls#Group2_versus_Group3_repos |
| Upregulated in class | 1 |
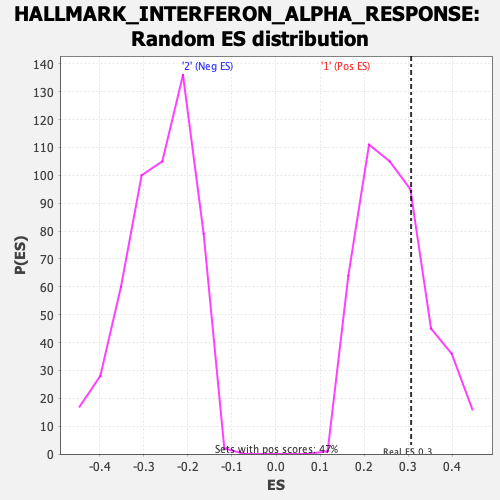
| GeneSet | HALLMARK_INTERFERON_ALPHA_RESPONSE |
| Enrichment Score (ES) | 0.30679446 |
| Normalized Enrichment Score (NES) | 1.1393313 |
| Nominal p-value | 0.2896406 |
| FDR q-value | 0.6554238 |
| FWER p-Value | 0.929 |
| SYMBOL | RANK IN GENE LIST | RANK METRIC SCORE | RUNNING ES | CORE ENRICHMENT | |
|---|---|---|---|---|---|
| 1 | Parp14 | 44 | 0.859 | 0.0340 | Yes |
| 2 | Ogfr | 190 | 0.669 | 0.0550 | Yes |
| 3 | Csf1 | 222 | 0.655 | 0.0811 | Yes |
| 4 | Rsad2 | 237 | 0.648 | 0.1077 | Yes |
| 5 | Ifitm3 | 315 | 0.612 | 0.1297 | Yes |
| 6 | Mov10 | 532 | 0.551 | 0.1421 | Yes |
| 7 | Lap3 | 795 | 0.493 | 0.1498 | Yes |
| 8 | Irf9 | 872 | 0.483 | 0.1664 | Yes |
| 9 | Ifit3 | 974 | 0.468 | 0.1810 | Yes |
| 10 | Parp12 | 991 | 0.466 | 0.1999 | Yes |
| 11 | Cd74 | 1030 | 0.461 | 0.2175 | Yes |
| 12 | Plscr1 | 1119 | 0.448 | 0.2320 | Yes |
| 13 | Trim25 | 1179 | 0.443 | 0.2477 | Yes |
| 14 | Ifitm1 | 1250 | 0.434 | 0.2625 | Yes |
| 15 | Ube2l6 | 1741 | 0.386 | 0.2542 | Yes |
| 16 | Dhx58 | 1837 | 0.378 | 0.2654 | Yes |
| 17 | Psma3 | 2177 | 0.351 | 0.2632 | Yes |
| 18 | Cmpk2 | 2680 | 0.313 | 0.2512 | Yes |
| 19 | Cmtr1 | 2784 | 0.305 | 0.2590 | Yes |
| 20 | Gbp3 | 2828 | 0.303 | 0.2696 | Yes |
| 21 | Il4ra | 2883 | 0.298 | 0.2795 | Yes |
| 22 | Cxcl10 | 2947 | 0.295 | 0.2887 | Yes |
| 23 | Casp1 | 3043 | 0.290 | 0.2962 | Yes |
| 24 | Bst2 | 3265 | 0.276 | 0.2968 | Yes |
| 25 | Helz2 | 3547 | 0.261 | 0.2937 | Yes |
| 26 | Ifih1 | 3844 | 0.245 | 0.2892 | Yes |
| 27 | Samd9l | 3907 | 0.241 | 0.2962 | Yes |
| 28 | Nub1 | 3989 | 0.238 | 0.3022 | Yes |
| 29 | Mx2 | 4095 | 0.233 | 0.3068 | Yes |
| 30 | Eif2ak2 | 4423 | 0.214 | 0.2994 | No |
| 31 | Tdrd7 | 4623 | 0.205 | 0.2981 | No |
| 32 | Wars1 | 5512 | 0.162 | 0.2604 | No |
| 33 | Mvb12a | 5833 | 0.148 | 0.2506 | No |
| 34 | Pnpt1 | 5856 | 0.147 | 0.2557 | No |
| 35 | Elf1 | 5991 | 0.141 | 0.2549 | No |
| 36 | Tmem140 | 6000 | 0.140 | 0.2604 | No |
| 37 | Oas1a | 6023 | 0.139 | 0.2652 | No |
| 38 | Trafd1 | 6134 | 0.134 | 0.2653 | No |
| 39 | Slc25a28 | 6163 | 0.133 | 0.2696 | No |
| 40 | Ifit2 | 6168 | 0.133 | 0.2750 | No |
| 41 | Irf1 | 6321 | 0.127 | 0.2727 | No |
| 42 | Ifi30 | 6357 | 0.125 | 0.2763 | No |
| 43 | Adar | 6552 | 0.118 | 0.2715 | No |
| 44 | Ifitm2 | 6875 | 0.106 | 0.2598 | No |
| 45 | Parp9 | 6904 | 0.105 | 0.2629 | No |
| 46 | Oasl1 | 7043 | 0.098 | 0.2601 | No |
| 47 | Ifi44 | 7098 | 0.096 | 0.2614 | No |
| 48 | Isg20 | 7443 | 0.081 | 0.2476 | No |
| 49 | Rnf31 | 7840 | 0.064 | 0.2304 | No |
| 50 | Cd47 | 7964 | 0.059 | 0.2267 | No |
| 51 | Cnp | 7969 | 0.059 | 0.2290 | No |
| 52 | Sell | 8016 | 0.057 | 0.2291 | No |
| 53 | Psme1 | 8616 | 0.030 | 0.2003 | No |
| 54 | Irf2 | 8649 | 0.029 | 0.1999 | No |
| 55 | Gmpr | 9028 | 0.011 | 0.1815 | No |
| 56 | Isg15 | 9411 | -0.003 | 0.1624 | No |
| 57 | Trim21 | 9482 | -0.007 | 0.1592 | No |
| 58 | Ifi27 | 9887 | -0.023 | 0.1399 | No |
| 59 | Ripk2 | 9910 | -0.024 | 0.1398 | No |
| 60 | Procr | 10095 | -0.032 | 0.1320 | No |
| 61 | Trim14 | 10101 | -0.033 | 0.1331 | No |
| 62 | Il7 | 10114 | -0.033 | 0.1339 | No |
| 63 | Trim12c | 10338 | -0.044 | 0.1246 | No |
| 64 | Irf7 | 10483 | -0.049 | 0.1194 | No |
| 65 | Herc6 | 10655 | -0.056 | 0.1132 | No |
| 66 | Tap1 | 10753 | -0.060 | 0.1109 | No |
| 67 | Epsti1 | 11461 | -0.088 | 0.0791 | No |
| 68 | Tent5a | 11882 | -0.107 | 0.0626 | No |
| 69 | Ddx60 | 12012 | -0.113 | 0.0609 | No |
| 70 | Uba7 | 12492 | -0.134 | 0.0425 | No |
| 71 | B2m | 13120 | -0.161 | 0.0178 | No |
| 72 | Lgals3bp | 14764 | -0.242 | -0.0544 | No |
| 73 | Ncoa7 | 14826 | -0.245 | -0.0471 | No |
| 74 | Psme2 | 14859 | -0.246 | -0.0383 | No |
| 75 | Casp8 | 14939 | -0.250 | -0.0317 | No |
| 76 | Usp18 | 15102 | -0.257 | -0.0290 | No |
| 77 | Sp110 | 15132 | -0.258 | -0.0196 | No |
| 78 | Txnip | 15223 | -0.262 | -0.0130 | No |
| 79 | Ly6e | 15256 | -0.264 | -0.0034 | No |
| 80 | Psmb8 | 15653 | -0.286 | -0.0112 | No |
| 81 | Psmb9 | 16779 | -0.350 | -0.0529 | No |
| 82 | Stat2 | 17467 | -0.397 | -0.0706 | No |
| 83 | Nmi | 17470 | -0.397 | -0.0540 | No |
| 84 | Batf2 | 17893 | -0.433 | -0.0569 | No |
| 85 | Ccrl2 | 18774 | -0.527 | -0.0788 | No |
| 86 | Ifi35 | 18937 | -0.550 | -0.0637 | No |
| 87 | Il15 | 19338 | -0.628 | -0.0572 | No |
| 88 | Trim26 | 19432 | -0.649 | -0.0345 | No |
| 89 | Rtp4 | 19623 | -0.713 | -0.0139 | No |
| 90 | Lpar6 | 19792 | -0.808 | 0.0117 | No |