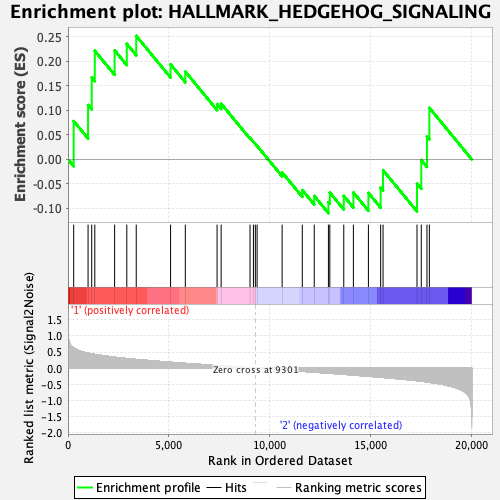
Profile of the Running ES Score & Positions of GeneSet Members on the Rank Ordered List
| Dataset | GMP.GMP.neu_Pheno.cls #Group2_versus_Group3.GMP.neu_Pheno.cls #Group2_versus_Group3_repos |
| Phenotype | GMP.neu_Pheno.cls#Group2_versus_Group3_repos |
| Upregulated in class | 1 |
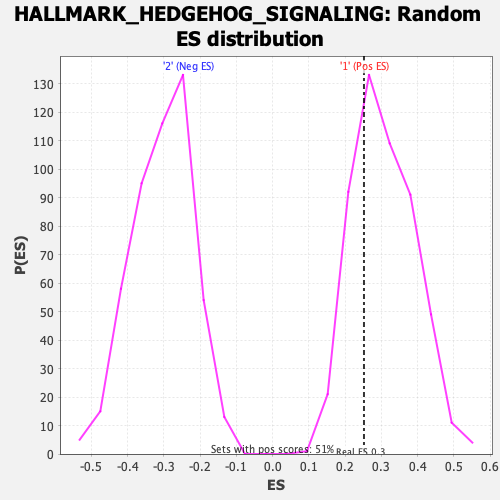
| GeneSet | HALLMARK_HEDGEHOG_SIGNALING |
| Enrichment Score (ES) | 0.25219136 |
| Normalized Enrichment Score (NES) | 0.8246393 |
| Nominal p-value | 0.7162427 |
| FDR q-value | 0.9039205 |
| FWER p-Value | 0.999 |
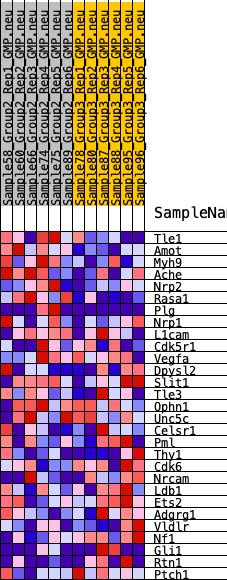
| SYMBOL | RANK IN GENE LIST | RANK METRIC SCORE | RUNNING ES | CORE ENRICHMENT | |
|---|---|---|---|---|---|
| 1 | Tle1 | 282 | 0.629 | 0.0783 | Yes |
| 2 | Amot | 995 | 0.466 | 0.1111 | Yes |
| 3 | Myh9 | 1177 | 0.443 | 0.1671 | Yes |
| 4 | Ache | 1329 | 0.423 | 0.2217 | Yes |
| 5 | Nrp2 | 2312 | 0.340 | 0.2226 | Yes |
| 6 | Rasa1 | 2916 | 0.296 | 0.2359 | Yes |
| 7 | Plg | 3384 | 0.270 | 0.2522 | Yes |
| 8 | Nrp1 | 5087 | 0.183 | 0.1940 | No |
| 9 | L1cam | 5818 | 0.149 | 0.1793 | No |
| 10 | Cdk5r1 | 7393 | 0.084 | 0.1129 | No |
| 11 | Vegfa | 7594 | 0.074 | 0.1138 | No |
| 12 | Dpysl2 | 9027 | 0.011 | 0.0439 | No |
| 13 | Slit1 | 9196 | 0.004 | 0.0361 | No |
| 14 | Tle3 | 9291 | 0.000 | 0.0315 | No |
| 15 | Ophn1 | 9378 | -0.002 | 0.0275 | No |
| 16 | Unc5c | 10619 | -0.055 | -0.0265 | No |
| 17 | Celsr1 | 11619 | -0.095 | -0.0626 | No |
| 18 | Pml | 12212 | -0.120 | -0.0746 | No |
| 19 | Thy1 | 12915 | -0.154 | -0.0871 | No |
| 20 | Cdk6 | 12984 | -0.156 | -0.0677 | No |
| 21 | Nrcam | 13676 | -0.188 | -0.0746 | No |
| 22 | Ldb1 | 14153 | -0.209 | -0.0676 | No |
| 23 | Ets2 | 14898 | -0.248 | -0.0684 | No |
| 24 | Adgrg1 | 15505 | -0.278 | -0.0579 | No |
| 25 | Vldlr | 15624 | -0.285 | -0.0220 | No |
| 26 | Nf1 | 17308 | -0.385 | -0.0496 | No |
| 27 | Gli1 | 17520 | -0.400 | -0.0013 | No |
| 28 | Rtn1 | 17802 | -0.426 | 0.0472 | No |
| 29 | Ptch1 | 17921 | -0.436 | 0.1053 | No |