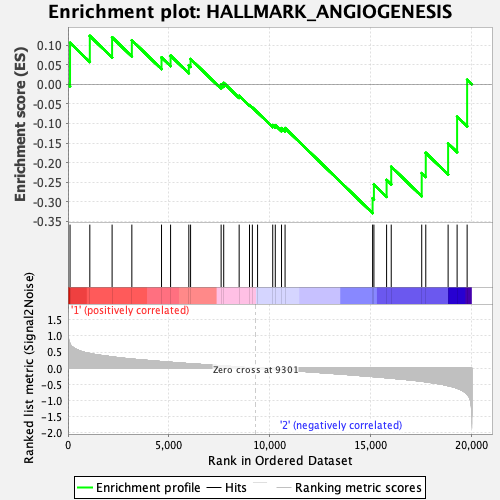
Profile of the Running ES Score & Positions of GeneSet Members on the Rank Ordered List
| Dataset | GMP.GMP.neu_Pheno.cls #Group2_versus_Group3.GMP.neu_Pheno.cls #Group2_versus_Group3_repos |
| Phenotype | GMP.neu_Pheno.cls#Group2_versus_Group3_repos |
| Upregulated in class | 2 |
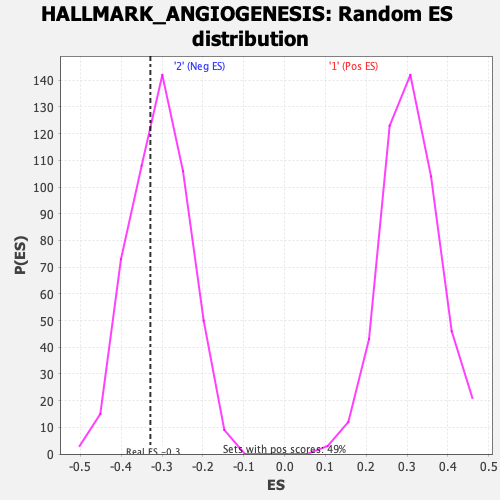
| GeneSet | HALLMARK_ANGIOGENESIS |
| Enrichment Score (ES) | -0.32877952 |
| Normalized Enrichment Score (NES) | -1.0710069 |
| Nominal p-value | 0.36956522 |
| FDR q-value | 1.0 |
| FWER p-Value | 0.973 |
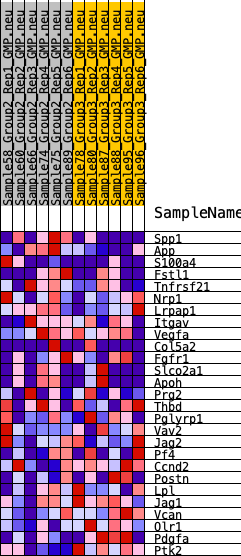
| SYMBOL | RANK IN GENE LIST | RANK METRIC SCORE | RUNNING ES | CORE ENRICHMENT | |
|---|---|---|---|---|---|
| 1 | Spp1 | 101 | 0.754 | 0.1058 | No |
| 2 | App | 1082 | 0.454 | 0.1235 | No |
| 3 | S100a4 | 2187 | 0.351 | 0.1198 | No |
| 4 | Fstl1 | 3166 | 0.281 | 0.1123 | No |
| 5 | Tnfrsf21 | 4638 | 0.204 | 0.0687 | No |
| 6 | Nrp1 | 5087 | 0.183 | 0.0732 | No |
| 7 | Lrpap1 | 5992 | 0.141 | 0.0486 | No |
| 8 | Itgav | 6079 | 0.137 | 0.0644 | No |
| 9 | Vegfa | 7594 | 0.074 | -0.0004 | No |
| 10 | Col5a2 | 7722 | 0.069 | 0.0034 | No |
| 11 | Fgfr1 | 8488 | 0.037 | -0.0295 | No |
| 12 | Slco2a1 | 9001 | 0.013 | -0.0532 | No |
| 13 | Apoh | 9143 | 0.006 | -0.0594 | No |
| 14 | Prg2 | 9401 | -0.003 | -0.0718 | No |
| 15 | Thbd | 10153 | -0.035 | -0.1041 | No |
| 16 | Pglyrp1 | 10280 | -0.041 | -0.1044 | No |
| 17 | Vav2 | 10589 | -0.054 | -0.1119 | No |
| 18 | Jag2 | 10765 | -0.060 | -0.1118 | No |
| 19 | Pf4 | 15106 | -0.258 | -0.2909 | Yes |
| 20 | Ccnd2 | 15171 | -0.260 | -0.2559 | Yes |
| 21 | Postn | 15800 | -0.294 | -0.2441 | Yes |
| 22 | Lpl | 16030 | -0.308 | -0.2102 | Yes |
| 23 | Jag1 | 17542 | -0.402 | -0.2266 | Yes |
| 24 | Vcan | 17743 | -0.420 | -0.1749 | Yes |
| 25 | Olr1 | 18851 | -0.539 | -0.1511 | Yes |
| 26 | Pdgfa | 19297 | -0.618 | -0.0824 | Yes |
| 27 | Ptk2 | 19794 | -0.808 | 0.0116 | Yes |