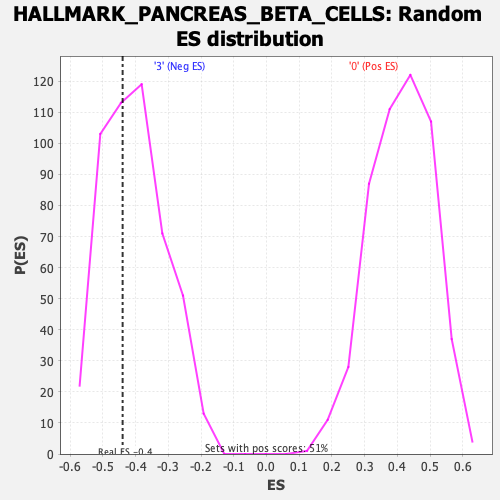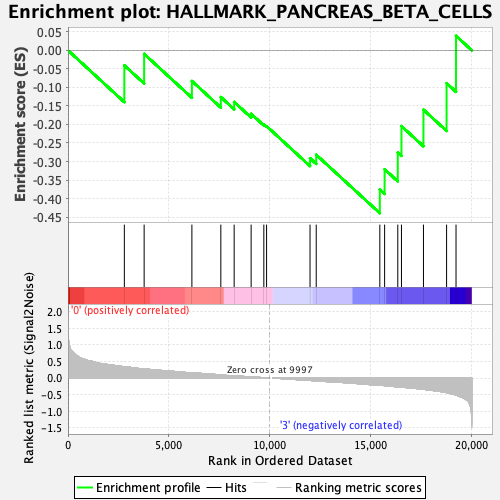
Profile of the Running ES Score & Positions of GeneSet Members on the Rank Ordered List
| Dataset | GMP.GMP.neu_Pheno.cls #Group1_versus_Group4.GMP.neu_Pheno.cls #Group1_versus_Group4_repos |
| Phenotype | GMP.neu_Pheno.cls#Group1_versus_Group4_repos |
| Upregulated in class | 3 |
| GeneSet | HALLMARK_PANCREAS_BETA_CELLS |
| Enrichment Score (ES) | -0.4394555 |
| Normalized Enrichment Score (NES) | -1.0850863 |
| Nominal p-value | 0.38617885 |
| FDR q-value | 0.8042738 |
| FWER p-Value | 0.975 |
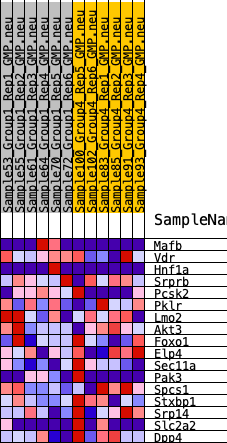
| SYMBOL | RANK IN GENE LIST | RANK METRIC SCORE | RUNNING ES | CORE ENRICHMENT | |
|---|---|---|---|---|---|
| 1 | Mafb | 2794 | 0.338 | -0.0406 | No |
| 2 | Vdr | 3776 | 0.273 | -0.0096 | No |
| 3 | Hnf1a | 6144 | 0.154 | -0.0828 | No |
| 4 | Srprb | 7579 | 0.097 | -0.1261 | No |
| 5 | Pcsk2 | 8240 | 0.068 | -0.1393 | No |
| 6 | Pklr | 9082 | 0.034 | -0.1713 | No |
| 7 | Lmo2 | 9712 | 0.011 | -0.1996 | No |
| 8 | Akt3 | 9848 | 0.006 | -0.2047 | No |
| 9 | Foxo1 | 12003 | -0.072 | -0.2912 | No |
| 10 | Elp4 | 12310 | -0.084 | -0.2819 | No |
| 11 | Sec11a | 15464 | -0.218 | -0.3757 | Yes |
| 12 | Pak3 | 15702 | -0.227 | -0.3210 | Yes |
| 13 | Spcs1 | 16355 | -0.265 | -0.2758 | Yes |
| 14 | Stxbp1 | 16537 | -0.274 | -0.2046 | Yes |
| 15 | Srp14 | 17628 | -0.337 | -0.1602 | Yes |
| 16 | Slc2a2 | 18775 | -0.439 | -0.0887 | Yes |
| 17 | Dpp4 | 19243 | -0.516 | 0.0391 | Yes |