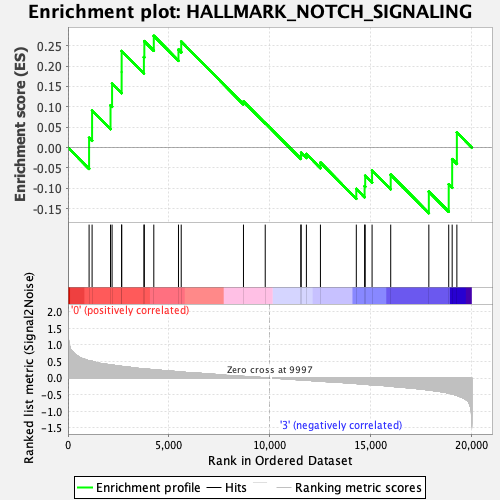
Profile of the Running ES Score & Positions of GeneSet Members on the Rank Ordered List
| Dataset | GMP.GMP.neu_Pheno.cls #Group1_versus_Group4.GMP.neu_Pheno.cls #Group1_versus_Group4_repos |
| Phenotype | GMP.neu_Pheno.cls#Group1_versus_Group4_repos |
| Upregulated in class | 0 |
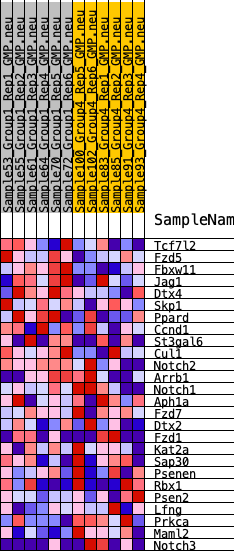
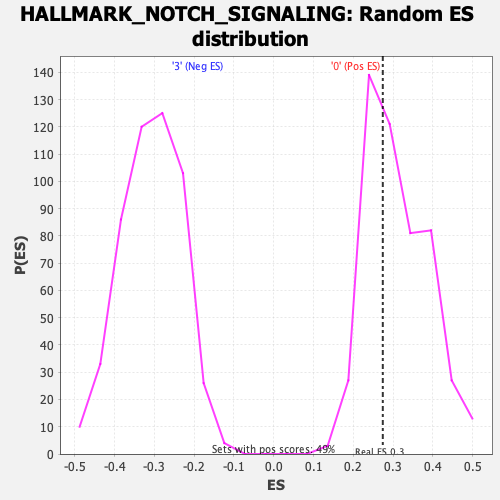
| GeneSet | HALLMARK_NOTCH_SIGNALING |
| Enrichment Score (ES) | 0.27415496 |
| Normalized Enrichment Score (NES) | 0.8812979 |
| Nominal p-value | 0.6166329 |
| FDR q-value | 1.0 |
| FWER p-Value | 1.0 |
| SYMBOL | RANK IN GENE LIST | RANK METRIC SCORE | RUNNING ES | CORE ENRICHMENT | |
|---|---|---|---|---|---|
| 1 | Tcf7l2 | 1046 | 0.518 | 0.0240 | Yes |
| 2 | Fzd5 | 1195 | 0.505 | 0.0910 | Yes |
| 3 | Fbxw11 | 2109 | 0.396 | 0.1037 | Yes |
| 4 | Jag1 | 2186 | 0.389 | 0.1572 | Yes |
| 5 | Dtx4 | 2660 | 0.351 | 0.1853 | Yes |
| 6 | Skp1 | 2661 | 0.351 | 0.2369 | Yes |
| 7 | Ppard | 3764 | 0.273 | 0.2221 | Yes |
| 8 | Ccnd1 | 3786 | 0.272 | 0.2611 | Yes |
| 9 | St3gal6 | 4255 | 0.247 | 0.2742 | Yes |
| 10 | Cul1 | 5479 | 0.187 | 0.2406 | No |
| 11 | Notch2 | 5615 | 0.180 | 0.2603 | No |
| 12 | Arrb1 | 8702 | 0.048 | 0.1131 | No |
| 13 | Notch1 | 9781 | 0.008 | 0.0604 | No |
| 14 | Aph1a | 11547 | -0.054 | -0.0199 | No |
| 15 | Fzd7 | 11562 | -0.055 | -0.0125 | No |
| 16 | Dtx2 | 11823 | -0.065 | -0.0158 | No |
| 17 | Fzd1 | 12519 | -0.093 | -0.0368 | No |
| 18 | Kat2a | 14298 | -0.164 | -0.1016 | No |
| 19 | Sap30 | 14709 | -0.184 | -0.0949 | No |
| 20 | Psenen | 14739 | -0.185 | -0.0691 | No |
| 21 | Rbx1 | 15080 | -0.203 | -0.0562 | No |
| 22 | Psen2 | 16004 | -0.244 | -0.0665 | No |
| 23 | Lfng | 17895 | -0.358 | -0.1082 | No |
| 24 | Prkca | 18881 | -0.456 | -0.0903 | No |
| 25 | Maml2 | 19052 | -0.477 | -0.0285 | No |
| 26 | Notch3 | 19285 | -0.524 | 0.0370 | No |