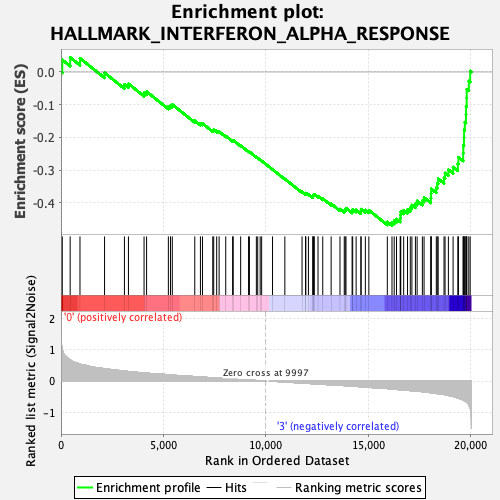
Profile of the Running ES Score & Positions of GeneSet Members on the Rank Ordered List
| Dataset | GMP.GMP.neu_Pheno.cls #Group1_versus_Group4.GMP.neu_Pheno.cls #Group1_versus_Group4_repos |
| Phenotype | GMP.neu_Pheno.cls#Group1_versus_Group4_repos |
| Upregulated in class | 3 |
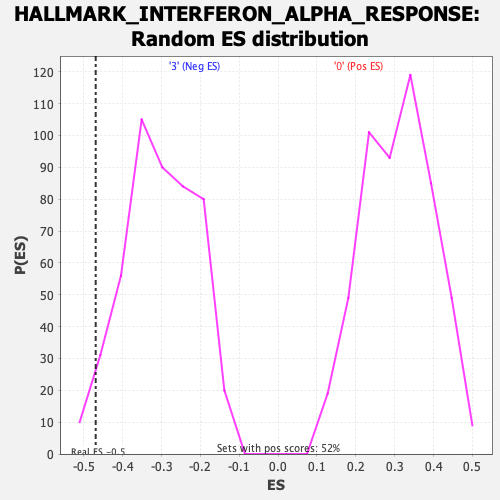
| GeneSet | HALLMARK_INTERFERON_ALPHA_RESPONSE |
| Enrichment Score (ES) | -0.46950626 |
| Normalized Enrichment Score (NES) | -1.5538706 |
| Nominal p-value | 0.031512607 |
| FDR q-value | 0.56862533 |
| FWER p-Value | 0.296 |
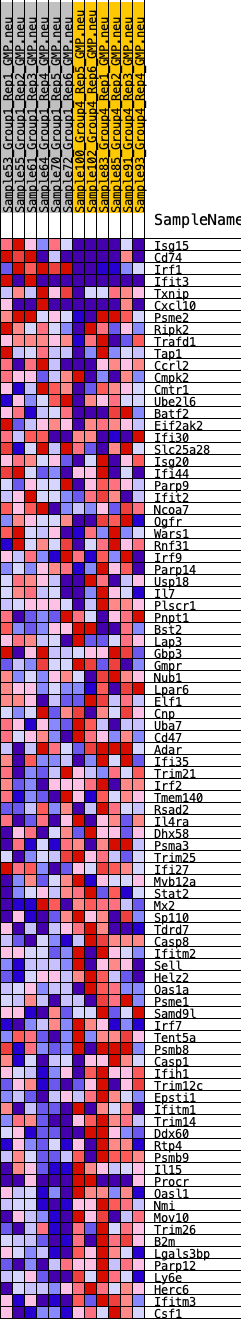
| SYMBOL | RANK IN GENE LIST | RANK METRIC SCORE | RUNNING ES | CORE ENRICHMENT | |
|---|---|---|---|---|---|
| 1 | Isg15 | 62 | 1.011 | 0.0371 | No |
| 2 | Cd74 | 447 | 0.673 | 0.0446 | No |
| 3 | Irf1 | 926 | 0.538 | 0.0420 | No |
| 4 | Ifit3 | 2125 | 0.395 | -0.0024 | No |
| 5 | Txnip | 3094 | 0.320 | -0.0382 | No |
| 6 | Cxcl10 | 3290 | 0.303 | -0.0359 | No |
| 7 | Psme2 | 4052 | 0.260 | -0.0638 | No |
| 8 | Ripk2 | 4176 | 0.252 | -0.0599 | No |
| 9 | Trafd1 | 5238 | 0.200 | -0.1052 | No |
| 10 | Tap1 | 5342 | 0.195 | -0.1026 | No |
| 11 | Ccrl2 | 5430 | 0.190 | -0.0995 | No |
| 12 | Cmpk2 | 6526 | 0.142 | -0.1487 | No |
| 13 | Cmtr1 | 6802 | 0.128 | -0.1574 | No |
| 14 | Ube2l6 | 6902 | 0.125 | -0.1574 | No |
| 15 | Batf2 | 7404 | 0.104 | -0.1784 | No |
| 16 | Eif2ak2 | 7450 | 0.102 | -0.1766 | No |
| 17 | Ifi30 | 7595 | 0.096 | -0.1800 | No |
| 18 | Slc25a28 | 7714 | 0.090 | -0.1824 | No |
| 19 | Isg20 | 8037 | 0.076 | -0.1955 | No |
| 20 | Ifi44 | 8372 | 0.062 | -0.2097 | No |
| 21 | Parp9 | 8402 | 0.061 | -0.2088 | No |
| 22 | Ifit2 | 8765 | 0.047 | -0.2251 | No |
| 23 | Ncoa7 | 9150 | 0.032 | -0.2431 | No |
| 24 | Ogfr | 9192 | 0.030 | -0.2439 | No |
| 25 | Wars1 | 9531 | 0.018 | -0.2602 | No |
| 26 | Rnf31 | 9597 | 0.015 | -0.2628 | No |
| 27 | Irf9 | 9717 | 0.010 | -0.2684 | No |
| 28 | Parp14 | 9789 | 0.008 | -0.2716 | No |
| 29 | Usp18 | 10320 | -0.006 | -0.2980 | No |
| 30 | Il7 | 10921 | -0.028 | -0.3269 | No |
| 31 | Plscr1 | 11760 | -0.062 | -0.3665 | No |
| 32 | Pnpt1 | 11930 | -0.069 | -0.3722 | No |
| 33 | Bst2 | 11944 | -0.070 | -0.3701 | No |
| 34 | Lap3 | 12071 | -0.075 | -0.3734 | No |
| 35 | Gbp3 | 12285 | -0.083 | -0.3808 | No |
| 36 | Gmpr | 12296 | -0.083 | -0.3780 | No |
| 37 | Nub1 | 12316 | -0.084 | -0.3756 | No |
| 38 | Lpar6 | 12359 | -0.086 | -0.3743 | No |
| 39 | Elf1 | 12539 | -0.094 | -0.3795 | No |
| 40 | Cnp | 12770 | -0.104 | -0.3869 | No |
| 41 | Uba7 | 13179 | -0.118 | -0.4027 | No |
| 42 | Cd47 | 13611 | -0.134 | -0.4190 | No |
| 43 | Adar | 13819 | -0.144 | -0.4237 | No |
| 44 | Ifi35 | 13864 | -0.146 | -0.4201 | No |
| 45 | Trim21 | 13904 | -0.147 | -0.4162 | No |
| 46 | Irf2 | 14202 | -0.160 | -0.4247 | No |
| 47 | Tmem140 | 14231 | -0.161 | -0.4198 | No |
| 48 | Rsad2 | 14398 | -0.169 | -0.4214 | No |
| 49 | Il4ra | 14630 | -0.180 | -0.4258 | No |
| 50 | Dhx58 | 14642 | -0.180 | -0.4192 | No |
| 51 | Psma3 | 14848 | -0.191 | -0.4219 | No |
| 52 | Trim25 | 15019 | -0.200 | -0.4224 | No |
| 53 | Ifi27 | 15920 | -0.238 | -0.4581 | No |
| 54 | Mvb12a | 16148 | -0.254 | -0.4594 | Yes |
| 55 | Stat2 | 16256 | -0.260 | -0.4545 | Yes |
| 56 | Mx2 | 16369 | -0.266 | -0.4495 | Yes |
| 57 | Sp110 | 16548 | -0.275 | -0.4475 | Yes |
| 58 | Tdrd7 | 16566 | -0.276 | -0.4374 | Yes |
| 59 | Casp8 | 16575 | -0.277 | -0.4268 | Yes |
| 60 | Ifitm2 | 16718 | -0.284 | -0.4226 | Yes |
| 61 | Sell | 16906 | -0.295 | -0.4203 | Yes |
| 62 | Helz2 | 17041 | -0.303 | -0.4150 | Yes |
| 63 | Oas1a | 17119 | -0.307 | -0.4066 | Yes |
| 64 | Psme1 | 17291 | -0.316 | -0.4026 | Yes |
| 65 | Samd9l | 17374 | -0.321 | -0.3940 | Yes |
| 66 | Irf7 | 17630 | -0.337 | -0.3934 | Yes |
| 67 | Tent5a | 17713 | -0.344 | -0.3838 | Yes |
| 68 | Psmb8 | 18044 | -0.370 | -0.3856 | Yes |
| 69 | Casp1 | 18054 | -0.371 | -0.3713 | Yes |
| 70 | Ifih1 | 18062 | -0.372 | -0.3569 | Yes |
| 71 | Trim12c | 18310 | -0.395 | -0.3536 | Yes |
| 72 | Epsti1 | 18357 | -0.399 | -0.3400 | Yes |
| 73 | Ifitm1 | 18401 | -0.403 | -0.3261 | Yes |
| 74 | Trim14 | 18686 | -0.427 | -0.3234 | Yes |
| 75 | Ddx60 | 18737 | -0.434 | -0.3087 | Yes |
| 76 | Rtp4 | 18899 | -0.458 | -0.2985 | Yes |
| 77 | Psmb9 | 19129 | -0.490 | -0.2905 | Yes |
| 78 | Il15 | 19360 | -0.537 | -0.2807 | Yes |
| 79 | Procr | 19391 | -0.543 | -0.2606 | Yes |
| 80 | Oasl1 | 19620 | -0.603 | -0.2481 | Yes |
| 81 | Nmi | 19627 | -0.606 | -0.2243 | Yes |
| 82 | Mov10 | 19660 | -0.620 | -0.2013 | Yes |
| 83 | Trim26 | 19665 | -0.621 | -0.1768 | Yes |
| 84 | B2m | 19702 | -0.634 | -0.1534 | Yes |
| 85 | Lgals3bp | 19757 | -0.653 | -0.1301 | Yes |
| 86 | Parp12 | 19763 | -0.655 | -0.1043 | Yes |
| 87 | Ly6e | 19792 | -0.667 | -0.0792 | Yes |
| 88 | Herc6 | 19796 | -0.671 | -0.0526 | Yes |
| 89 | Ifitm3 | 19896 | -0.756 | -0.0276 | Yes |
| 90 | Csf1 | 19963 | -0.856 | 0.0032 | Yes |