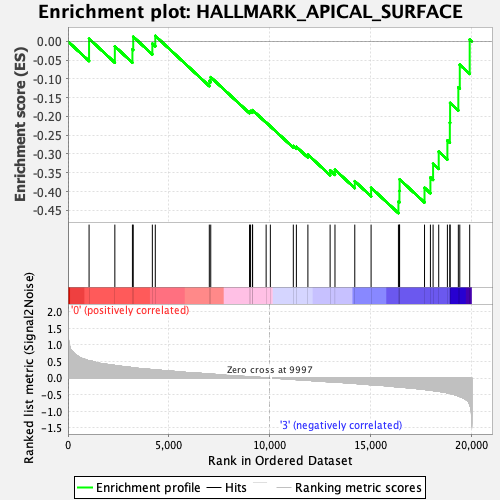
Profile of the Running ES Score & Positions of GeneSet Members on the Rank Ordered List
| Dataset | GMP.GMP.neu_Pheno.cls #Group1_versus_Group4.GMP.neu_Pheno.cls #Group1_versus_Group4_repos |
| Phenotype | GMP.neu_Pheno.cls#Group1_versus_Group4_repos |
| Upregulated in class | 3 |
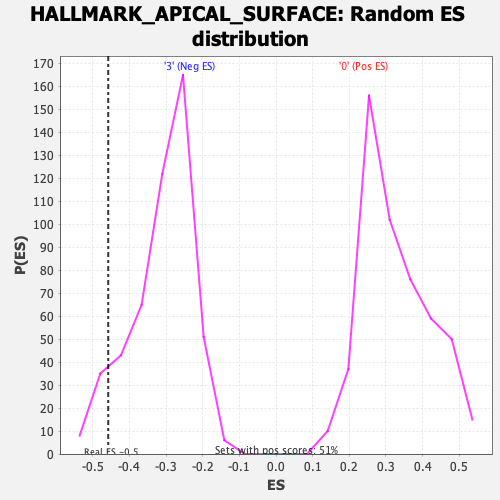
| GeneSet | HALLMARK_APICAL_SURFACE |
| Enrichment Score (ES) | -0.45769852 |
| Normalized Enrichment Score (NES) | -1.471746 |
| Nominal p-value | 0.08686869 |
| FDR q-value | 0.4930685 |
| FWER p-Value | 0.452 |
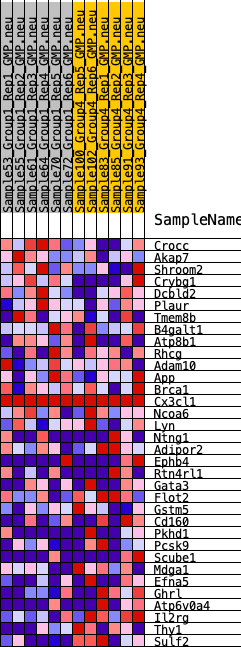
| SYMBOL | RANK IN GENE LIST | RANK METRIC SCORE | RUNNING ES | CORE ENRICHMENT | |
|---|---|---|---|---|---|
| 1 | Crocc | 1045 | 0.518 | 0.0074 | No |
| 2 | Akap7 | 2323 | 0.377 | -0.0130 | No |
| 3 | Shroom2 | 3195 | 0.311 | -0.0208 | No |
| 4 | Crybg1 | 3235 | 0.308 | 0.0127 | No |
| 5 | Dcbld2 | 4183 | 0.252 | -0.0057 | No |
| 6 | Plaur | 4329 | 0.242 | 0.0149 | No |
| 7 | Tmem8b | 7008 | 0.120 | -0.1052 | No |
| 8 | B4galt1 | 7079 | 0.117 | -0.0952 | No |
| 9 | Atp8b1 | 9003 | 0.038 | -0.1870 | No |
| 10 | Rhcg | 9053 | 0.035 | -0.1854 | No |
| 11 | Adam10 | 9147 | 0.032 | -0.1864 | No |
| 12 | App | 9156 | 0.032 | -0.1831 | No |
| 13 | Brca1 | 9826 | 0.007 | -0.2158 | No |
| 14 | Cx3cl1 | 10035 | 0.000 | -0.2262 | No |
| 15 | Ncoa6 | 11174 | -0.039 | -0.2786 | No |
| 16 | Lyn | 11326 | -0.045 | -0.2809 | No |
| 17 | Ntng1 | 11897 | -0.068 | -0.3016 | No |
| 18 | Adipor2 | 12999 | -0.113 | -0.3437 | No |
| 19 | Ephb4 | 13240 | -0.120 | -0.3419 | No |
| 20 | Rtn4rl1 | 14222 | -0.160 | -0.3725 | No |
| 21 | Gata3 | 15031 | -0.200 | -0.3899 | No |
| 22 | Flot2 | 16387 | -0.267 | -0.4270 | Yes |
| 23 | Gstm5 | 16436 | -0.270 | -0.3983 | Yes |
| 24 | Cd160 | 16445 | -0.270 | -0.3675 | Yes |
| 25 | Pkhd1 | 17681 | -0.341 | -0.3900 | Yes |
| 26 | Pcsk9 | 17973 | -0.365 | -0.3626 | Yes |
| 27 | Scube1 | 18106 | -0.376 | -0.3258 | Yes |
| 28 | Mdga1 | 18385 | -0.401 | -0.2935 | Yes |
| 29 | Efna5 | 18815 | -0.444 | -0.2639 | Yes |
| 30 | Ghrl | 18937 | -0.463 | -0.2166 | Yes |
| 31 | Atp6v0a4 | 18950 | -0.464 | -0.1638 | Yes |
| 32 | Il2rg | 19358 | -0.537 | -0.1223 | Yes |
| 33 | Thy1 | 19430 | -0.554 | -0.0620 | Yes |
| 34 | Sulf2 | 19921 | -0.797 | 0.0053 | Yes |