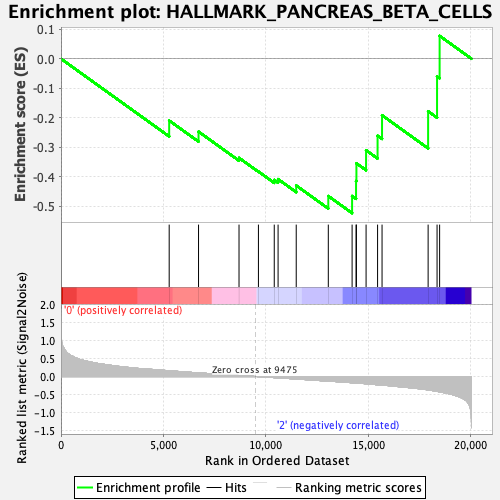
Profile of the Running ES Score & Positions of GeneSet Members on the Rank Ordered List
| Dataset | GMP.GMP.neu_Pheno.cls #Group1_versus_Group3.GMP.neu_Pheno.cls #Group1_versus_Group3_repos |
| Phenotype | GMP.neu_Pheno.cls#Group1_versus_Group3_repos |
| Upregulated in class | 2 |
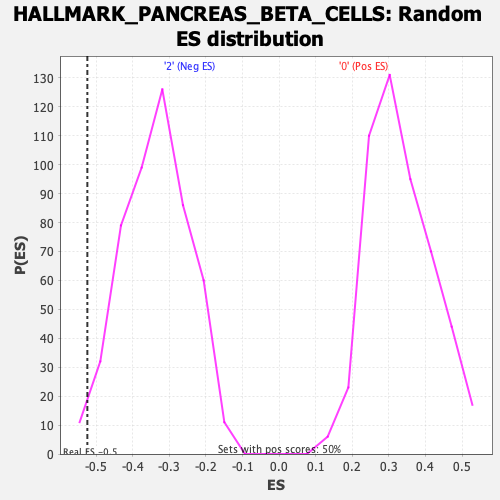
| GeneSet | HALLMARK_PANCREAS_BETA_CELLS |
| Enrichment Score (ES) | -0.5240348 |
| Normalized Enrichment Score (NES) | -1.5549916 |
| Nominal p-value | 0.013888889 |
| FDR q-value | 0.65356046 |
| FWER p-Value | 0.299 |
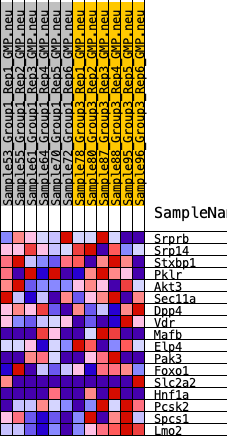
| SYMBOL | RANK IN GENE LIST | RANK METRIC SCORE | RUNNING ES | CORE ENRICHMENT | |
|---|---|---|---|---|---|
| 1 | Srprb | 5278 | 0.159 | -0.2099 | No |
| 2 | Srp14 | 6710 | 0.100 | -0.2474 | No |
| 3 | Stxbp1 | 8685 | 0.028 | -0.3365 | No |
| 4 | Pklr | 9632 | -0.003 | -0.3828 | No |
| 5 | Akt3 | 10404 | -0.029 | -0.4115 | No |
| 6 | Sec11a | 10591 | -0.036 | -0.4087 | No |
| 7 | Dpp4 | 11476 | -0.067 | -0.4303 | No |
| 8 | Vdr | 13041 | -0.125 | -0.4661 | Yes |
| 9 | Mafb | 14202 | -0.172 | -0.4659 | Yes |
| 10 | Elp4 | 14395 | -0.179 | -0.4149 | Yes |
| 11 | Pak3 | 14413 | -0.180 | -0.3548 | Yes |
| 12 | Foxo1 | 14884 | -0.200 | -0.3106 | Yes |
| 13 | Slc2a2 | 15445 | -0.228 | -0.2613 | Yes |
| 14 | Hnf1a | 15663 | -0.237 | -0.1919 | Yes |
| 15 | Pcsk2 | 17911 | -0.372 | -0.1783 | Yes |
| 16 | Spcs1 | 18347 | -0.413 | -0.0602 | Yes |
| 17 | Lmo2 | 18472 | -0.426 | 0.0777 | Yes |