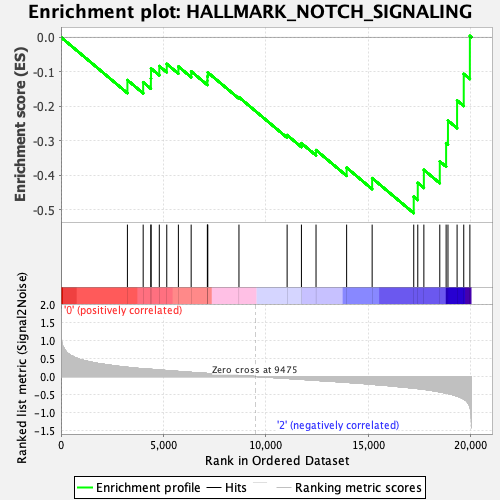
Profile of the Running ES Score & Positions of GeneSet Members on the Rank Ordered List
| Dataset | GMP.GMP.neu_Pheno.cls #Group1_versus_Group3.GMP.neu_Pheno.cls #Group1_versus_Group3_repos |
| Phenotype | GMP.neu_Pheno.cls#Group1_versus_Group3_repos |
| Upregulated in class | 2 |
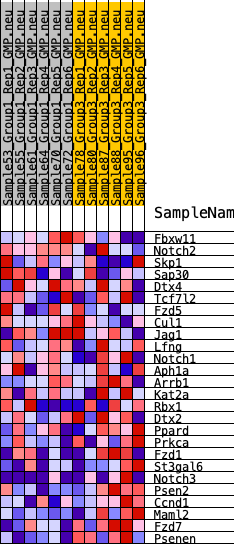
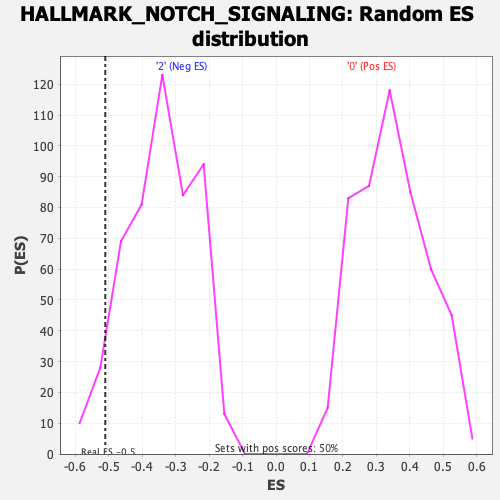
| GeneSet | HALLMARK_NOTCH_SIGNALING |
| Enrichment Score (ES) | -0.5096495 |
| Normalized Enrichment Score (NES) | -1.4772614 |
| Nominal p-value | 0.059760958 |
| FDR q-value | 0.61625814 |
| FWER p-Value | 0.458 |
| SYMBOL | RANK IN GENE LIST | RANK METRIC SCORE | RUNNING ES | CORE ENRICHMENT | |
|---|---|---|---|---|---|
| 1 | Fbxw11 | 3240 | 0.255 | -0.1241 | No |
| 2 | Notch2 | 4009 | 0.216 | -0.1304 | No |
| 3 | Skp1 | 4385 | 0.199 | -0.1196 | No |
| 4 | Sap30 | 4393 | 0.199 | -0.0904 | No |
| 5 | Dtx4 | 4796 | 0.182 | -0.0836 | No |
| 6 | Tcf7l2 | 5160 | 0.165 | -0.0773 | No |
| 7 | Fzd5 | 5727 | 0.140 | -0.0848 | No |
| 8 | Cul1 | 6350 | 0.115 | -0.0989 | No |
| 9 | Jag1 | 7142 | 0.084 | -0.1259 | No |
| 10 | Lfng | 7145 | 0.084 | -0.1136 | No |
| 11 | Notch1 | 7162 | 0.083 | -0.1020 | No |
| 12 | Aph1a | 8682 | 0.028 | -0.1737 | No |
| 13 | Arrb1 | 11032 | -0.052 | -0.2835 | No |
| 14 | Kat2a | 11730 | -0.077 | -0.3070 | No |
| 15 | Rbx1 | 12442 | -0.104 | -0.3271 | No |
| 16 | Dtx2 | 13935 | -0.160 | -0.3779 | No |
| 17 | Ppard | 15180 | -0.215 | -0.4083 | No |
| 18 | Prkca | 17209 | -0.322 | -0.4619 | Yes |
| 19 | Fzd1 | 17406 | -0.335 | -0.4220 | Yes |
| 20 | St3gal6 | 17703 | -0.355 | -0.3842 | Yes |
| 21 | Notch3 | 18480 | -0.426 | -0.3597 | Yes |
| 22 | Psen2 | 18789 | -0.460 | -0.3069 | Yes |
| 23 | Ccnd1 | 18879 | -0.471 | -0.2414 | Yes |
| 24 | Maml2 | 19324 | -0.543 | -0.1831 | Yes |
| 25 | Fzd7 | 19649 | -0.627 | -0.1063 | Yes |
| 26 | Psenen | 19948 | -0.843 | 0.0039 | Yes |