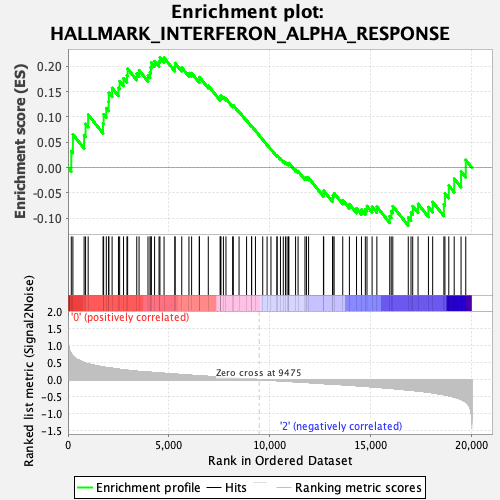
Profile of the Running ES Score & Positions of GeneSet Members on the Rank Ordered List
| Dataset | GMP.GMP.neu_Pheno.cls #Group1_versus_Group3.GMP.neu_Pheno.cls #Group1_versus_Group3_repos |
| Phenotype | GMP.neu_Pheno.cls#Group1_versus_Group3_repos |
| Upregulated in class | 0 |
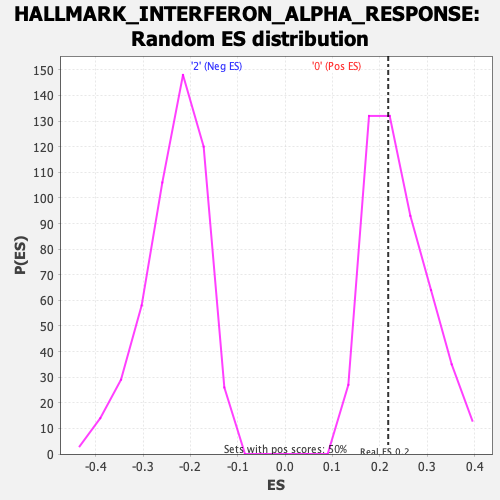
| GeneSet | HALLMARK_INTERFERON_ALPHA_RESPONSE |
| Enrichment Score (ES) | 0.21768467 |
| Normalized Enrichment Score (NES) | 0.9160739 |
| Nominal p-value | 0.5423387 |
| FDR q-value | 0.7688467 |
| FWER p-Value | 0.995 |
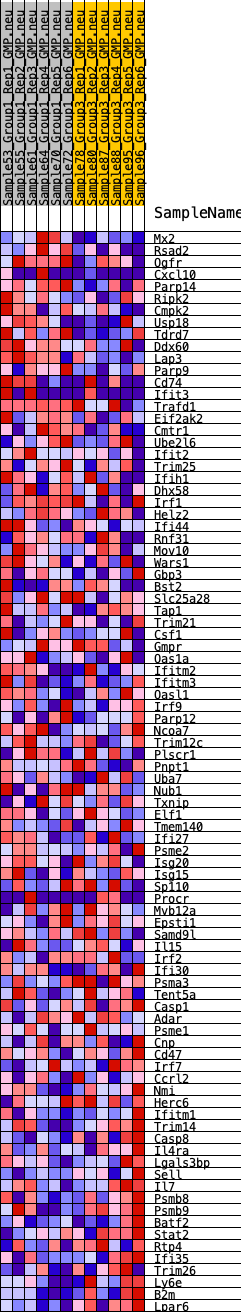
| SYMBOL | RANK IN GENE LIST | RANK METRIC SCORE | RUNNING ES | CORE ENRICHMENT | |
|---|---|---|---|---|---|
| 1 | Mx2 | 163 | 0.765 | 0.0325 | Yes |
| 2 | Rsad2 | 242 | 0.695 | 0.0655 | Yes |
| 3 | Ogfr | 799 | 0.501 | 0.0642 | Yes |
| 4 | Cxcl10 | 871 | 0.484 | 0.0863 | Yes |
| 5 | Parp14 | 1000 | 0.463 | 0.1045 | Yes |
| 6 | Ripk2 | 1739 | 0.370 | 0.0871 | Yes |
| 7 | Cmpk2 | 1767 | 0.367 | 0.1053 | Yes |
| 8 | Usp18 | 1900 | 0.354 | 0.1175 | Yes |
| 9 | Tdrd7 | 2015 | 0.344 | 0.1300 | Yes |
| 10 | Ddx60 | 2025 | 0.343 | 0.1478 | Yes |
| 11 | Lap3 | 2187 | 0.331 | 0.1573 | Yes |
| 12 | Parp9 | 2503 | 0.305 | 0.1577 | Yes |
| 13 | Cd74 | 2561 | 0.300 | 0.1707 | Yes |
| 14 | Ifit3 | 2753 | 0.285 | 0.1763 | Yes |
| 15 | Trafd1 | 2924 | 0.274 | 0.1824 | Yes |
| 16 | Eif2ak2 | 2957 | 0.272 | 0.1952 | Yes |
| 17 | Cmtr1 | 3410 | 0.244 | 0.1855 | Yes |
| 18 | Ube2l6 | 3524 | 0.237 | 0.1924 | Yes |
| 19 | Ifit2 | 3967 | 0.218 | 0.1818 | Yes |
| 20 | Trim25 | 4067 | 0.215 | 0.1883 | Yes |
| 21 | Ifih1 | 4110 | 0.212 | 0.1974 | Yes |
| 22 | Dhx58 | 4133 | 0.212 | 0.2076 | Yes |
| 23 | Irf1 | 4294 | 0.204 | 0.2104 | Yes |
| 24 | Helz2 | 4515 | 0.194 | 0.2096 | Yes |
| 25 | Ifi44 | 4559 | 0.192 | 0.2177 | Yes |
| 26 | Rnf31 | 4764 | 0.183 | 0.2172 | No |
| 27 | Mov10 | 5300 | 0.158 | 0.1987 | No |
| 28 | Wars1 | 5311 | 0.157 | 0.2066 | No |
| 29 | Gbp3 | 5641 | 0.145 | 0.1978 | No |
| 30 | Bst2 | 5998 | 0.128 | 0.1867 | No |
| 31 | Slc25a28 | 6130 | 0.124 | 0.1867 | No |
| 32 | Tap1 | 6509 | 0.108 | 0.1735 | No |
| 33 | Trim21 | 6520 | 0.108 | 0.1788 | No |
| 34 | Csf1 | 6957 | 0.092 | 0.1618 | No |
| 35 | Gmpr | 7543 | 0.072 | 0.1363 | No |
| 36 | Oas1a | 7573 | 0.071 | 0.1386 | No |
| 37 | Ifitm2 | 7578 | 0.070 | 0.1421 | No |
| 38 | Ifitm3 | 7707 | 0.065 | 0.1392 | No |
| 39 | Oasl1 | 7833 | 0.060 | 0.1361 | No |
| 40 | Irf9 | 8165 | 0.048 | 0.1220 | No |
| 41 | Parp12 | 8197 | 0.046 | 0.1229 | No |
| 42 | Ncoa7 | 8483 | 0.035 | 0.1105 | No |
| 43 | Trim12c | 8856 | 0.022 | 0.0931 | No |
| 44 | Plscr1 | 9105 | 0.014 | 0.0814 | No |
| 45 | Pnpt1 | 9106 | 0.014 | 0.0821 | No |
| 46 | Uba7 | 9296 | 0.007 | 0.0730 | No |
| 47 | Nub1 | 9657 | -0.004 | 0.0551 | No |
| 48 | Txnip | 9873 | -0.011 | 0.0449 | No |
| 49 | Elf1 | 10065 | -0.017 | 0.0363 | No |
| 50 | Tmem140 | 10362 | -0.028 | 0.0229 | No |
| 51 | Ifi27 | 10369 | -0.028 | 0.0241 | No |
| 52 | Psme2 | 10536 | -0.034 | 0.0176 | No |
| 53 | Isg20 | 10677 | -0.039 | 0.0126 | No |
| 54 | Isg15 | 10784 | -0.043 | 0.0096 | No |
| 55 | Sp110 | 10865 | -0.046 | 0.0080 | No |
| 56 | Procr | 10936 | -0.049 | 0.0071 | No |
| 57 | Mvb12a | 10954 | -0.049 | 0.0089 | No |
| 58 | Epsti1 | 11286 | -0.060 | -0.0045 | No |
| 59 | Samd9l | 11410 | -0.064 | -0.0073 | No |
| 60 | Il15 | 11752 | -0.078 | -0.0202 | No |
| 61 | Irf2 | 11826 | -0.081 | -0.0196 | No |
| 62 | Ifi30 | 11931 | -0.084 | -0.0204 | No |
| 63 | Psma3 | 12668 | -0.113 | -0.0513 | No |
| 64 | Tent5a | 12682 | -0.114 | -0.0458 | No |
| 65 | Casp1 | 13117 | -0.129 | -0.0608 | No |
| 66 | Adar | 13140 | -0.129 | -0.0550 | No |
| 67 | Psme1 | 13197 | -0.132 | -0.0508 | No |
| 68 | Cnp | 13625 | -0.147 | -0.0644 | No |
| 69 | Cd47 | 13955 | -0.161 | -0.0724 | No |
| 70 | Irf7 | 14309 | -0.175 | -0.0808 | No |
| 71 | Ccrl2 | 14554 | -0.185 | -0.0832 | No |
| 72 | Nmi | 14745 | -0.193 | -0.0825 | No |
| 73 | Herc6 | 14828 | -0.197 | -0.0761 | No |
| 74 | Ifitm1 | 15081 | -0.210 | -0.0776 | No |
| 75 | Trim14 | 15317 | -0.222 | -0.0776 | No |
| 76 | Casp8 | 15955 | -0.252 | -0.0962 | No |
| 77 | Il4ra | 16029 | -0.255 | -0.0863 | No |
| 78 | Lgals3bp | 16108 | -0.259 | -0.0764 | No |
| 79 | Sell | 16875 | -0.304 | -0.0987 | No |
| 80 | Il7 | 17011 | -0.311 | -0.0889 | No |
| 81 | Psmb8 | 17095 | -0.316 | -0.0763 | No |
| 82 | Psmb9 | 17360 | -0.331 | -0.0720 | No |
| 83 | Batf2 | 17875 | -0.368 | -0.0782 | No |
| 84 | Stat2 | 18085 | -0.387 | -0.0681 | No |
| 85 | Rtp4 | 18641 | -0.442 | -0.0725 | No |
| 86 | Ifi35 | 18693 | -0.450 | -0.0511 | No |
| 87 | Trim26 | 18884 | -0.472 | -0.0356 | No |
| 88 | Ly6e | 19152 | -0.510 | -0.0219 | No |
| 89 | B2m | 19493 | -0.582 | -0.0080 | No |
| 90 | Lpar6 | 19726 | -0.653 | 0.0150 | No |