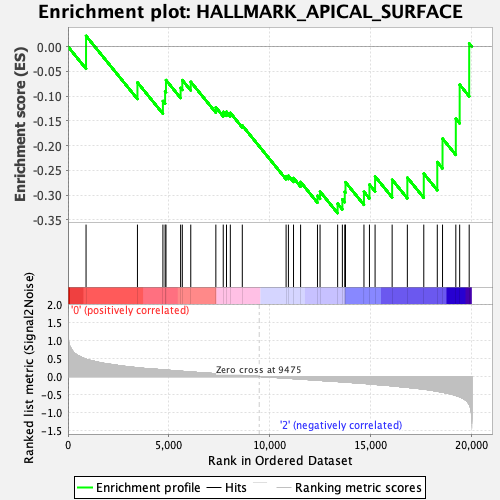
Profile of the Running ES Score & Positions of GeneSet Members on the Rank Ordered List
| Dataset | GMP.GMP.neu_Pheno.cls #Group1_versus_Group3.GMP.neu_Pheno.cls #Group1_versus_Group3_repos |
| Phenotype | GMP.neu_Pheno.cls#Group1_versus_Group3_repos |
| Upregulated in class | 2 |
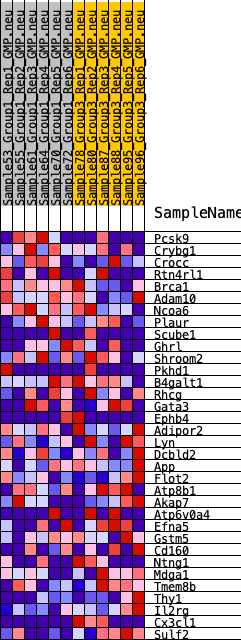
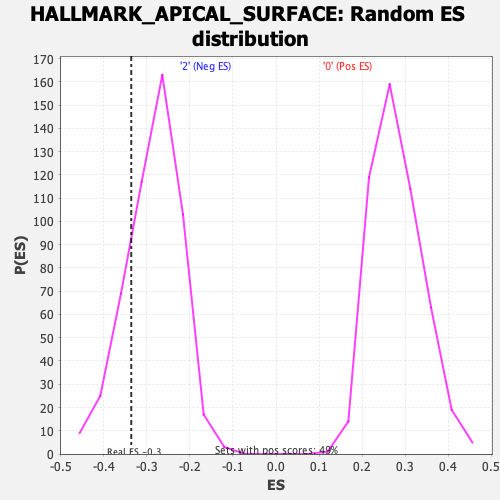
| GeneSet | HALLMARK_APICAL_SURFACE |
| Enrichment Score (ES) | -0.33614802 |
| Normalized Enrichment Score (NES) | -1.18216 |
| Nominal p-value | 0.20158103 |
| FDR q-value | 0.96956503 |
| FWER p-Value | 0.908 |
| SYMBOL | RANK IN GENE LIST | RANK METRIC SCORE | RUNNING ES | CORE ENRICHMENT | |
|---|---|---|---|---|---|
| 1 | Pcsk9 | 895 | 0.479 | 0.0217 | No |
| 2 | Crybg1 | 3444 | 0.241 | -0.0723 | No |
| 3 | Crocc | 4707 | 0.185 | -0.1098 | No |
| 4 | Rtn4rl1 | 4816 | 0.180 | -0.0901 | No |
| 5 | Brca1 | 4859 | 0.178 | -0.0675 | No |
| 6 | Adam10 | 5585 | 0.147 | -0.0834 | No |
| 7 | Ncoa6 | 5669 | 0.143 | -0.0676 | No |
| 8 | Plaur | 6088 | 0.125 | -0.0711 | No |
| 9 | Scube1 | 7332 | 0.078 | -0.1225 | No |
| 10 | Ghrl | 7699 | 0.066 | -0.1317 | No |
| 11 | Shroom2 | 7860 | 0.059 | -0.1314 | No |
| 12 | Pkhd1 | 8050 | 0.052 | -0.1336 | No |
| 13 | B4galt1 | 8644 | 0.030 | -0.1592 | No |
| 14 | Rhcg | 10816 | -0.044 | -0.2616 | No |
| 15 | Gata3 | 10931 | -0.049 | -0.2606 | No |
| 16 | Ephb4 | 11184 | -0.057 | -0.2652 | No |
| 17 | Adipor2 | 11535 | -0.069 | -0.2732 | No |
| 18 | Lyn | 12372 | -0.101 | -0.3010 | No |
| 19 | Dcbld2 | 12500 | -0.106 | -0.2926 | No |
| 20 | App | 13372 | -0.138 | -0.3169 | Yes |
| 21 | Flot2 | 13607 | -0.147 | -0.3082 | Yes |
| 22 | Atp8b1 | 13726 | -0.151 | -0.2931 | Yes |
| 23 | Akap7 | 13762 | -0.153 | -0.2737 | Yes |
| 24 | Atp6v0a4 | 14677 | -0.190 | -0.2930 | Yes |
| 25 | Efna5 | 14950 | -0.203 | -0.2784 | Yes |
| 26 | Gstm5 | 15229 | -0.217 | -0.2621 | Yes |
| 27 | Cd160 | 16075 | -0.258 | -0.2686 | Yes |
| 28 | Ntng1 | 16829 | -0.301 | -0.2644 | Yes |
| 29 | Mdga1 | 17644 | -0.351 | -0.2564 | Yes |
| 30 | Tmem8b | 18314 | -0.409 | -0.2330 | Yes |
| 31 | Thy1 | 18574 | -0.434 | -0.1856 | Yes |
| 32 | Il2rg | 19233 | -0.526 | -0.1456 | Yes |
| 33 | Cx3cl1 | 19424 | -0.564 | -0.0768 | Yes |
| 34 | Sulf2 | 19896 | -0.769 | 0.0065 | Yes |