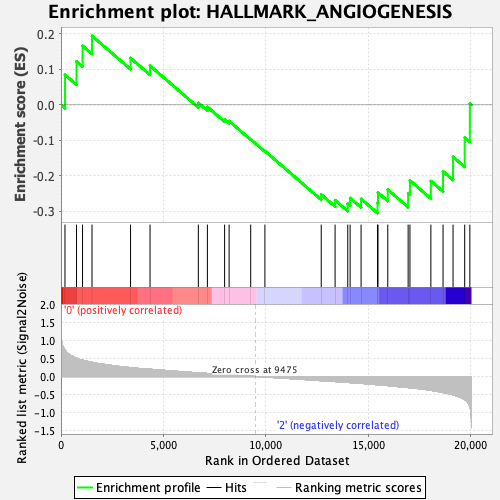
Profile of the Running ES Score & Positions of GeneSet Members on the Rank Ordered List
| Dataset | GMP.GMP.neu_Pheno.cls #Group1_versus_Group3.GMP.neu_Pheno.cls #Group1_versus_Group3_repos |
| Phenotype | GMP.neu_Pheno.cls#Group1_versus_Group3_repos |
| Upregulated in class | 2 |
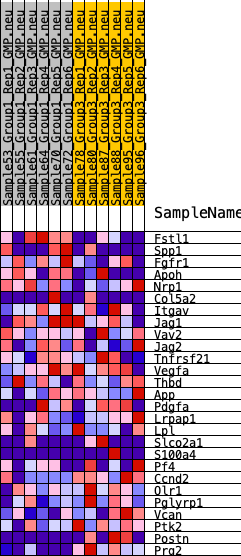
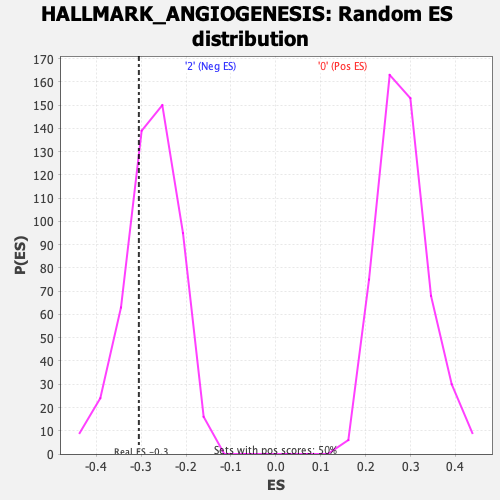
| GeneSet | HALLMARK_ANGIOGENESIS |
| Enrichment Score (ES) | -0.30498388 |
| Normalized Enrichment Score (NES) | -1.0988451 |
| Nominal p-value | 0.28629032 |
| FDR q-value | 0.76591825 |
| FWER p-Value | 0.97 |
| SYMBOL | RANK IN GENE LIST | RANK METRIC SCORE | RUNNING ES | CORE ENRICHMENT | |
|---|---|---|---|---|---|
| 1 | Fstl1 | 194 | 0.732 | 0.0847 | No |
| 2 | Spp1 | 757 | 0.511 | 0.1225 | No |
| 3 | Fgfr1 | 1051 | 0.455 | 0.1664 | No |
| 4 | Apoh | 1513 | 0.395 | 0.1943 | No |
| 5 | Nrp1 | 3393 | 0.245 | 0.1319 | No |
| 6 | Col5a2 | 4344 | 0.201 | 0.1103 | No |
| 7 | Itgav | 6700 | 0.101 | 0.0056 | No |
| 8 | Jag1 | 7142 | 0.084 | -0.0056 | No |
| 9 | Vav2 | 7982 | 0.054 | -0.0406 | No |
| 10 | Jag2 | 8202 | 0.046 | -0.0456 | No |
| 11 | Tnfrsf21 | 9255 | 0.008 | -0.0972 | No |
| 12 | Vegfa | 9948 | -0.013 | -0.1301 | No |
| 13 | Thbd | 12696 | -0.115 | -0.2526 | No |
| 14 | App | 13372 | -0.138 | -0.2685 | No |
| 15 | Pdgfa | 13990 | -0.163 | -0.2784 | Yes |
| 16 | Lrpap1 | 14105 | -0.168 | -0.2624 | Yes |
| 17 | Lpl | 14640 | -0.188 | -0.2649 | Yes |
| 18 | Slco2a1 | 15443 | -0.228 | -0.2756 | Yes |
| 19 | S100a4 | 15465 | -0.229 | -0.2471 | Yes |
| 20 | Pf4 | 15942 | -0.251 | -0.2386 | Yes |
| 21 | Ccnd2 | 16936 | -0.307 | -0.2487 | Yes |
| 22 | Olr1 | 17024 | -0.311 | -0.2129 | Yes |
| 23 | Pglyrp1 | 18045 | -0.382 | -0.2146 | Yes |
| 24 | Vcan | 18639 | -0.442 | -0.1873 | Yes |
| 25 | Ptk2 | 19127 | -0.506 | -0.1464 | Yes |
| 26 | Postn | 19695 | -0.644 | -0.0917 | Yes |
| 27 | Prg2 | 19946 | -0.839 | 0.0040 | Yes |