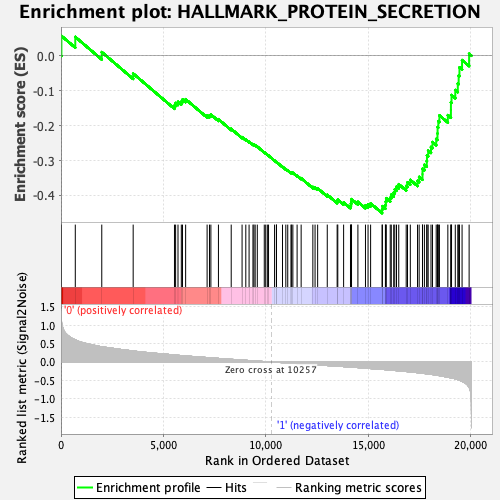
Profile of the Running ES Score & Positions of GeneSet Members on the Rank Ordered List
| Dataset | GMP.GMP.neu_Pheno.cls #Group1_versus_Group2.GMP.neu_Pheno.cls #Group1_versus_Group2_repos |
| Phenotype | GMP.neu_Pheno.cls#Group1_versus_Group2_repos |
| Upregulated in class | 1 |
| GeneSet | HALLMARK_PROTEIN_SECRETION |
| Enrichment Score (ES) | -0.4507595 |
| Normalized Enrichment Score (NES) | -1.9271666 |
| Nominal p-value | 0.0020833334 |
| FDR q-value | 0.017792922 |
| FWER p-Value | 0.014 |
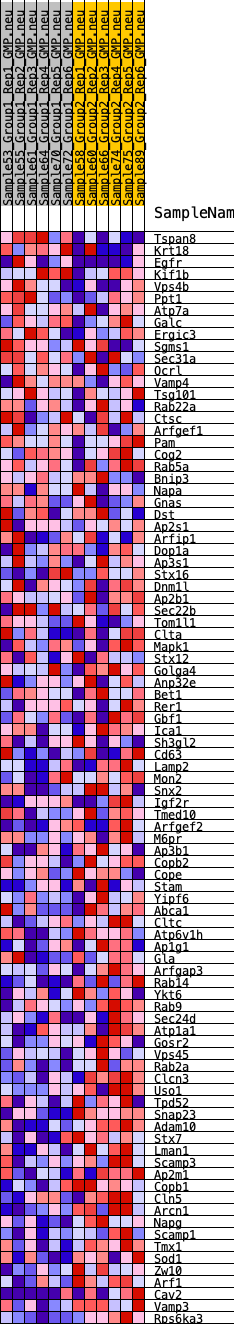
| SYMBOL | RANK IN GENE LIST | RANK METRIC SCORE | RUNNING ES | CORE ENRICHMENT | |
|---|---|---|---|---|---|
| 1 | Tspan8 | 20 | 1.125 | 0.0569 | No |
| 2 | Krt18 | 697 | 0.600 | 0.0539 | No |
| 3 | Egfr | 1989 | 0.412 | 0.0104 | No |
| 4 | Kif1b | 3521 | 0.299 | -0.0510 | No |
| 5 | Vps4b | 5536 | 0.189 | -0.1423 | No |
| 6 | Ppt1 | 5591 | 0.186 | -0.1354 | No |
| 7 | Atp7a | 5708 | 0.180 | -0.1319 | No |
| 8 | Galc | 5870 | 0.172 | -0.1311 | No |
| 9 | Ergic3 | 5927 | 0.170 | -0.1252 | No |
| 10 | Sgms1 | 6081 | 0.162 | -0.1245 | No |
| 11 | Sec31a | 7128 | 0.119 | -0.1709 | No |
| 12 | Ocrl | 7244 | 0.115 | -0.1707 | No |
| 13 | Vamp4 | 7312 | 0.112 | -0.1683 | No |
| 14 | Tsg101 | 7681 | 0.096 | -0.1818 | No |
| 15 | Rab22a | 8304 | 0.071 | -0.2094 | No |
| 16 | Ctsc | 8834 | 0.052 | -0.2333 | No |
| 17 | Arfgef1 | 9016 | 0.045 | -0.2400 | No |
| 18 | Pam | 9176 | 0.038 | -0.2460 | No |
| 19 | Cog2 | 9365 | 0.031 | -0.2539 | No |
| 20 | Rab5a | 9412 | 0.029 | -0.2547 | No |
| 21 | Bnip3 | 9472 | 0.027 | -0.2563 | No |
| 22 | Napa | 9577 | 0.023 | -0.2603 | No |
| 23 | Gnas | 9917 | 0.011 | -0.2767 | No |
| 24 | Dst | 9987 | 0.009 | -0.2797 | No |
| 25 | Ap2s1 | 10067 | 0.006 | -0.2834 | No |
| 26 | Arfip1 | 10125 | 0.005 | -0.2860 | No |
| 27 | Dop1a | 10419 | -0.004 | -0.3004 | No |
| 28 | Ap3s1 | 10510 | -0.007 | -0.3046 | No |
| 29 | Stx16 | 10512 | -0.007 | -0.3043 | No |
| 30 | Dnm1l | 10806 | -0.018 | -0.3181 | No |
| 31 | Ap2b1 | 10968 | -0.023 | -0.3249 | No |
| 32 | Sec22b | 11062 | -0.026 | -0.3282 | No |
| 33 | Tom1l1 | 11219 | -0.032 | -0.3344 | No |
| 34 | Clta | 11252 | -0.033 | -0.3343 | No |
| 35 | Mapk1 | 11312 | -0.036 | -0.3354 | No |
| 36 | Stx12 | 11519 | -0.042 | -0.3435 | No |
| 37 | Golga4 | 11716 | -0.050 | -0.3508 | No |
| 38 | Anp32e | 12287 | -0.070 | -0.3758 | No |
| 39 | Bet1 | 12395 | -0.074 | -0.3774 | No |
| 40 | Rer1 | 12521 | -0.079 | -0.3796 | No |
| 41 | Gbf1 | 12990 | -0.096 | -0.3981 | No |
| 42 | Ica1 | 13472 | -0.112 | -0.4165 | No |
| 43 | Sh3gl2 | 13504 | -0.113 | -0.4122 | No |
| 44 | Cd63 | 13788 | -0.124 | -0.4200 | No |
| 45 | Lamp2 | 14123 | -0.137 | -0.4297 | No |
| 46 | Mon2 | 14145 | -0.138 | -0.4236 | No |
| 47 | Snx2 | 14162 | -0.139 | -0.4173 | No |
| 48 | Igf2r | 14174 | -0.139 | -0.4107 | No |
| 49 | Tmed10 | 14485 | -0.151 | -0.4184 | No |
| 50 | Arfgef2 | 14854 | -0.168 | -0.4283 | No |
| 51 | M6pr | 14980 | -0.173 | -0.4256 | No |
| 52 | Ap3b1 | 15105 | -0.178 | -0.4227 | No |
| 53 | Copb2 | 15665 | -0.200 | -0.4405 | Yes |
| 54 | Cope | 15680 | -0.201 | -0.4308 | Yes |
| 55 | Stam | 15827 | -0.206 | -0.4275 | Yes |
| 56 | Yipf6 | 15844 | -0.207 | -0.4177 | Yes |
| 57 | Abca1 | 15867 | -0.208 | -0.4080 | Yes |
| 58 | Cltc | 16062 | -0.218 | -0.4065 | Yes |
| 59 | Atp6v1h | 16113 | -0.221 | -0.3977 | Yes |
| 60 | Ap1g1 | 16232 | -0.226 | -0.3920 | Yes |
| 61 | Gla | 16284 | -0.229 | -0.3827 | Yes |
| 62 | Arfgap3 | 16368 | -0.234 | -0.3748 | Yes |
| 63 | Rab14 | 16478 | -0.239 | -0.3680 | Yes |
| 64 | Ykt6 | 16841 | -0.258 | -0.3729 | Yes |
| 65 | Rab9 | 16905 | -0.261 | -0.3626 | Yes |
| 66 | Sec24d | 17042 | -0.269 | -0.3555 | Yes |
| 67 | Atp1a1 | 17394 | -0.290 | -0.3582 | Yes |
| 68 | Gosr2 | 17473 | -0.294 | -0.3470 | Yes |
| 69 | Vps45 | 17636 | -0.306 | -0.3394 | Yes |
| 70 | Rab2a | 17637 | -0.306 | -0.3236 | Yes |
| 71 | Clcn3 | 17729 | -0.312 | -0.3121 | Yes |
| 72 | Uso1 | 17844 | -0.320 | -0.3014 | Yes |
| 73 | Tpd52 | 17855 | -0.321 | -0.2854 | Yes |
| 74 | Snap23 | 17913 | -0.325 | -0.2715 | Yes |
| 75 | Adam10 | 18051 | -0.334 | -0.2612 | Yes |
| 76 | Stx7 | 18123 | -0.340 | -0.2472 | Yes |
| 77 | Lman1 | 18305 | -0.354 | -0.2381 | Yes |
| 78 | Scamp3 | 18367 | -0.360 | -0.2226 | Yes |
| 79 | Ap2m1 | 18373 | -0.361 | -0.2043 | Yes |
| 80 | Copb1 | 18409 | -0.364 | -0.1873 | Yes |
| 81 | Cln5 | 18462 | -0.370 | -0.1708 | Yes |
| 82 | Arcn1 | 18873 | -0.412 | -0.1701 | Yes |
| 83 | Napg | 19023 | -0.429 | -0.1555 | Yes |
| 84 | Scamp1 | 19024 | -0.429 | -0.1334 | Yes |
| 85 | Tmx1 | 19053 | -0.432 | -0.1126 | Yes |
| 86 | Sod1 | 19236 | -0.456 | -0.0982 | Yes |
| 87 | Zw10 | 19359 | -0.477 | -0.0798 | Yes |
| 88 | Arf1 | 19401 | -0.485 | -0.0568 | Yes |
| 89 | Cav2 | 19440 | -0.494 | -0.0333 | Yes |
| 90 | Vamp3 | 19567 | -0.527 | -0.0125 | Yes |
| 91 | Rps6ka3 | 19911 | -0.688 | 0.0058 | Yes |