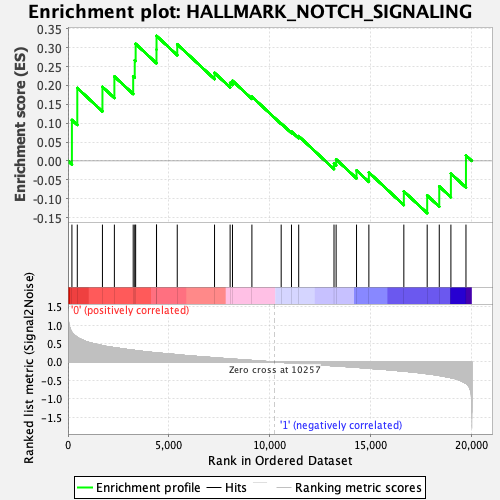
Profile of the Running ES Score & Positions of GeneSet Members on the Rank Ordered List
| Dataset | GMP.GMP.neu_Pheno.cls #Group1_versus_Group2.GMP.neu_Pheno.cls #Group1_versus_Group2_repos |
| Phenotype | GMP.neu_Pheno.cls#Group1_versus_Group2_repos |
| Upregulated in class | 0 |
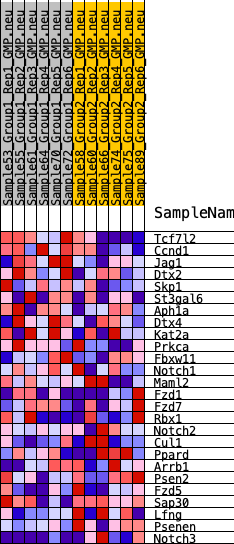
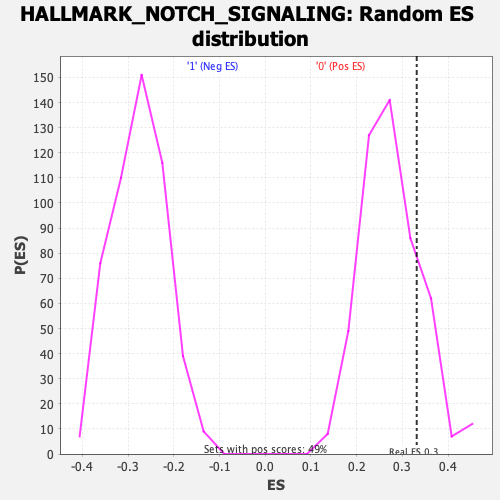
| GeneSet | HALLMARK_NOTCH_SIGNALING |
| Enrichment Score (ES) | 0.33133075 |
| Normalized Enrichment Score (NES) | 1.206497 |
| Nominal p-value | 0.18699187 |
| FDR q-value | 1.0 |
| FWER p-Value | 0.918 |
| SYMBOL | RANK IN GENE LIST | RANK METRIC SCORE | RUNNING ES | CORE ENRICHMENT | |
|---|---|---|---|---|---|
| 1 | Tcf7l2 | 194 | 0.800 | 0.1085 | Yes |
| 2 | Ccnd1 | 461 | 0.663 | 0.1933 | Yes |
| 3 | Jag1 | 1708 | 0.441 | 0.1962 | Yes |
| 4 | Dtx2 | 2300 | 0.387 | 0.2238 | Yes |
| 5 | Skp1 | 3233 | 0.318 | 0.2242 | Yes |
| 6 | St3gal6 | 3310 | 0.313 | 0.2667 | Yes |
| 7 | Aph1a | 3355 | 0.310 | 0.3102 | Yes |
| 8 | Dtx4 | 4388 | 0.246 | 0.2951 | Yes |
| 9 | Kat2a | 4391 | 0.246 | 0.3313 | Yes |
| 10 | Prkca | 5418 | 0.196 | 0.3090 | No |
| 11 | Fbxw11 | 7267 | 0.113 | 0.2334 | No |
| 12 | Notch1 | 8040 | 0.082 | 0.2069 | No |
| 13 | Maml2 | 8157 | 0.077 | 0.2124 | No |
| 14 | Fzd1 | 9120 | 0.041 | 0.1703 | No |
| 15 | Fzd7 | 10572 | -0.009 | 0.0992 | No |
| 16 | Rbx1 | 11083 | -0.027 | 0.0777 | No |
| 17 | Notch2 | 11441 | -0.040 | 0.0658 | No |
| 18 | Cul1 | 13192 | -0.103 | -0.0064 | No |
| 19 | Ppard | 13297 | -0.107 | 0.0041 | No |
| 20 | Arrb1 | 14309 | -0.144 | -0.0251 | No |
| 21 | Psen2 | 14921 | -0.170 | -0.0304 | No |
| 22 | Fzd5 | 16655 | -0.247 | -0.0806 | No |
| 23 | Sap30 | 17813 | -0.318 | -0.0914 | No |
| 24 | Lfng | 18412 | -0.364 | -0.0674 | No |
| 25 | Psenen | 18989 | -0.425 | -0.0334 | No |
| 26 | Notch3 | 19736 | -0.576 | 0.0145 | No |