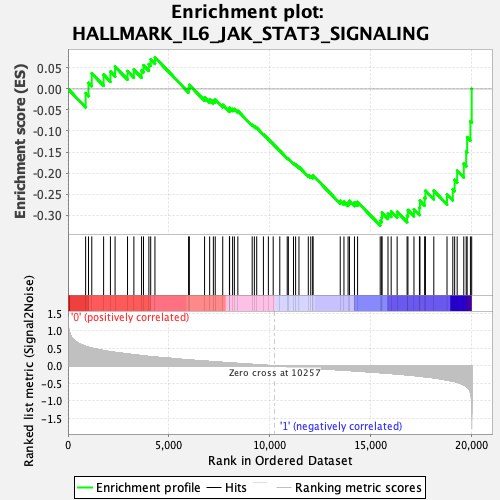
Profile of the Running ES Score & Positions of GeneSet Members on the Rank Ordered List
| Dataset | GMP.GMP.neu_Pheno.cls #Group1_versus_Group2.GMP.neu_Pheno.cls #Group1_versus_Group2_repos |
| Phenotype | GMP.neu_Pheno.cls#Group1_versus_Group2_repos |
| Upregulated in class | 1 |
| GeneSet | HALLMARK_IL6_JAK_STAT3_SIGNALING |
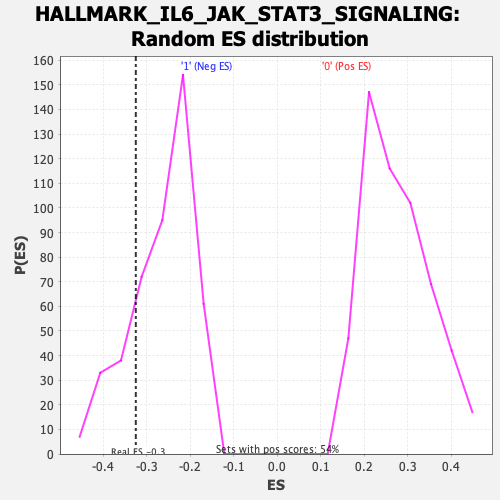
| Enrichment Score (ES) | -0.32507718 |
| Normalized Enrichment Score (NES) | -1.2332219 |
| Nominal p-value | 0.2 |
| FDR q-value | 0.52712435 |
| FWER p-Value | 0.861 |
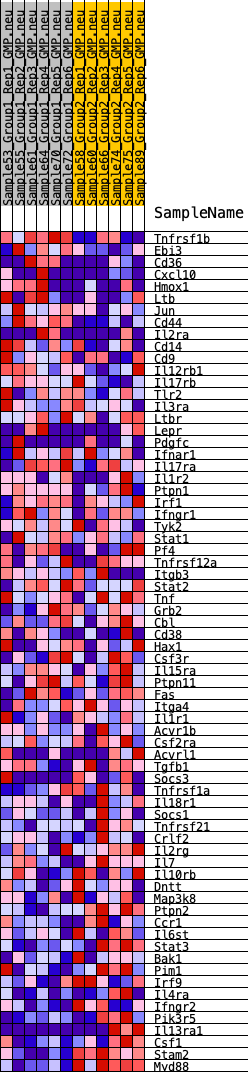
| SYMBOL | RANK IN GENE LIST | RANK METRIC SCORE | RUNNING ES | CORE ENRICHMENT | |
|---|---|---|---|---|---|
| 1 | Tnfrsf1b | 874 | 0.556 | -0.0102 | No |
| 2 | Ebi3 | 1016 | 0.532 | 0.0148 | No |
| 3 | Cd36 | 1179 | 0.507 | 0.0372 | No |
| 4 | Cxcl10 | 1766 | 0.434 | 0.0340 | No |
| 5 | Hmox1 | 2104 | 0.404 | 0.0414 | No |
| 6 | Ltb | 2335 | 0.384 | 0.0531 | No |
| 7 | Jun | 2952 | 0.337 | 0.0425 | No |
| 8 | Cd44 | 3267 | 0.315 | 0.0458 | No |
| 9 | Il2ra | 3648 | 0.290 | 0.0442 | No |
| 10 | Cd14 | 3744 | 0.282 | 0.0565 | No |
| 11 | Cd9 | 4011 | 0.266 | 0.0592 | No |
| 12 | Il12rb1 | 4101 | 0.262 | 0.0705 | No |
| 13 | Il17rb | 4312 | 0.250 | 0.0751 | No |
| 14 | Tlr2 | 5980 | 0.167 | 0.0016 | No |
| 15 | Il3ra | 6018 | 0.165 | 0.0097 | No |
| 16 | Ltbr | 6773 | 0.135 | -0.0200 | No |
| 17 | Lepr | 7025 | 0.124 | -0.0251 | No |
| 18 | Pdgfc | 7209 | 0.116 | -0.0273 | No |
| 19 | Ifnar1 | 7302 | 0.112 | -0.0251 | No |
| 20 | Il17ra | 7673 | 0.096 | -0.0378 | No |
| 21 | Il1r2 | 8006 | 0.083 | -0.0495 | No |
| 22 | Ptpn1 | 8014 | 0.082 | -0.0449 | No |
| 23 | Irf1 | 8163 | 0.077 | -0.0477 | No |
| 24 | Ifngr1 | 8251 | 0.072 | -0.0476 | No |
| 25 | Tyk2 | 8423 | 0.067 | -0.0522 | No |
| 26 | Stat1 | 9134 | 0.040 | -0.0853 | No |
| 27 | Pf4 | 9242 | 0.036 | -0.0885 | No |
| 28 | Tnfrsf12a | 9359 | 0.031 | -0.0925 | No |
| 29 | Itgb3 | 9691 | 0.020 | -0.1079 | No |
| 30 | Stat2 | 9937 | 0.010 | -0.1195 | No |
| 31 | Tnf | 10176 | 0.002 | -0.1313 | No |
| 32 | Grb2 | 10503 | -0.007 | -0.1472 | No |
| 33 | Cbl | 10872 | -0.021 | -0.1644 | No |
| 34 | Cd38 | 10928 | -0.022 | -0.1658 | No |
| 35 | Hax1 | 11183 | -0.031 | -0.1767 | No |
| 36 | Csf3r | 11288 | -0.035 | -0.1798 | No |
| 37 | Il15ra | 11454 | -0.040 | -0.1857 | No |
| 38 | Ptpn11 | 11917 | -0.057 | -0.2054 | No |
| 39 | Fas | 12039 | -0.061 | -0.2078 | No |
| 40 | Itga4 | 12138 | -0.064 | -0.2088 | No |
| 41 | Il1r1 | 12150 | -0.065 | -0.2055 | No |
| 42 | Acvr1b | 13501 | -0.113 | -0.2663 | No |
| 43 | Csf2ra | 13685 | -0.120 | -0.2682 | No |
| 44 | Acvrl1 | 13890 | -0.128 | -0.2707 | No |
| 45 | Tgfb1 | 13958 | -0.131 | -0.2661 | No |
| 46 | Socs3 | 14206 | -0.141 | -0.2700 | No |
| 47 | Tnfrsf1a | 14361 | -0.147 | -0.2689 | No |
| 48 | Il18r1 | 15483 | -0.192 | -0.3135 | Yes |
| 49 | Socs1 | 15559 | -0.195 | -0.3055 | Yes |
| 50 | Tnfrsf21 | 15572 | -0.196 | -0.2943 | Yes |
| 51 | Crlf2 | 15869 | -0.209 | -0.2966 | Yes |
| 52 | Il2rg | 16027 | -0.216 | -0.2914 | Yes |
| 53 | Il7 | 16323 | -0.232 | -0.2923 | Yes |
| 54 | Il10rb | 16816 | -0.256 | -0.3015 | Yes |
| 55 | Dntt | 16858 | -0.258 | -0.2880 | Yes |
| 56 | Map3k8 | 17157 | -0.275 | -0.2863 | Yes |
| 57 | Ptpn2 | 17429 | -0.291 | -0.2823 | Yes |
| 58 | Ccr1 | 17454 | -0.293 | -0.2659 | Yes |
| 59 | Il6st | 17686 | -0.309 | -0.2588 | Yes |
| 60 | Stat3 | 17726 | -0.312 | -0.2420 | Yes |
| 61 | Bak1 | 18141 | -0.341 | -0.2422 | Yes |
| 62 | Pim1 | 18796 | -0.404 | -0.2506 | Yes |
| 63 | Irf9 | 19084 | -0.436 | -0.2387 | Yes |
| 64 | Il4ra | 19175 | -0.446 | -0.2163 | Yes |
| 65 | Ifngr2 | 19300 | -0.467 | -0.1943 | Yes |
| 66 | Pik3r5 | 19628 | -0.545 | -0.1779 | Yes |
| 67 | Il13ra1 | 19747 | -0.580 | -0.1488 | Yes |
| 68 | Csf1 | 19795 | -0.604 | -0.1148 | Yes |
| 69 | Stam2 | 19957 | -0.762 | -0.0770 | Yes |
| 70 | Myd88 | 20020 | -1.333 | 0.0003 | Yes |