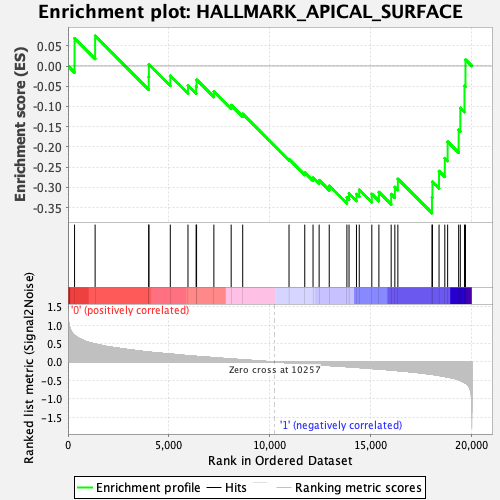
Profile of the Running ES Score & Positions of GeneSet Members on the Rank Ordered List
| Dataset | GMP.GMP.neu_Pheno.cls #Group1_versus_Group2.GMP.neu_Pheno.cls #Group1_versus_Group2_repos |
| Phenotype | GMP.neu_Pheno.cls#Group1_versus_Group2_repos |
| Upregulated in class | 1 |
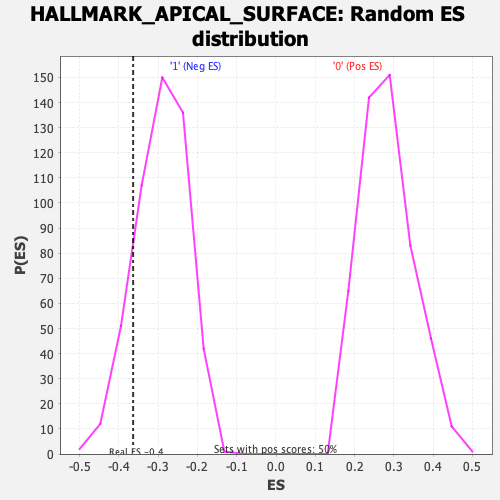
| GeneSet | HALLMARK_APICAL_SURFACE |
| Enrichment Score (ES) | -0.36392623 |
| Normalized Enrichment Score (NES) | -1.2412913 |
| Nominal p-value | 0.12974052 |
| FDR q-value | 0.56025803 |
| FWER p-Value | 0.85 |
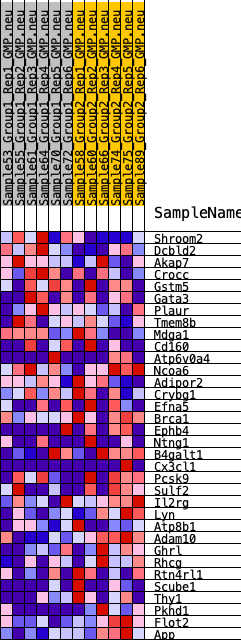
| SYMBOL | RANK IN GENE LIST | RANK METRIC SCORE | RUNNING ES | CORE ENRICHMENT | |
|---|---|---|---|---|---|
| 1 | Shroom2 | 325 | 0.722 | 0.0685 | No |
| 2 | Dcbld2 | 1345 | 0.485 | 0.0745 | No |
| 3 | Akap7 | 4004 | 0.267 | -0.0271 | No |
| 4 | Crocc | 4012 | 0.266 | 0.0039 | No |
| 5 | Gstm5 | 5073 | 0.214 | -0.0241 | No |
| 6 | Gata3 | 5950 | 0.168 | -0.0481 | No |
| 7 | Plaur | 6354 | 0.151 | -0.0505 | No |
| 8 | Tmem8b | 6376 | 0.150 | -0.0339 | No |
| 9 | Mdga1 | 7234 | 0.115 | -0.0632 | No |
| 10 | Cd160 | 8092 | 0.080 | -0.0967 | No |
| 11 | Atp6v0a4 | 8664 | 0.059 | -0.1184 | No |
| 12 | Ncoa6 | 10961 | -0.023 | -0.2305 | No |
| 13 | Adipor2 | 11741 | -0.051 | -0.2635 | No |
| 14 | Crybg1 | 12152 | -0.065 | -0.2763 | No |
| 15 | Efna5 | 12454 | -0.076 | -0.2824 | No |
| 16 | Brca1 | 12955 | -0.094 | -0.2964 | No |
| 17 | Ephb4 | 13831 | -0.126 | -0.3254 | Yes |
| 18 | Ntng1 | 13937 | -0.130 | -0.3153 | Yes |
| 19 | B4galt1 | 14306 | -0.144 | -0.3168 | Yes |
| 20 | Cx3cl1 | 14444 | -0.150 | -0.3061 | Yes |
| 21 | Pcsk9 | 15067 | -0.176 | -0.3166 | Yes |
| 22 | Sulf2 | 15418 | -0.190 | -0.3118 | Yes |
| 23 | Il2rg | 16027 | -0.216 | -0.3168 | Yes |
| 24 | Lyn | 16209 | -0.226 | -0.2994 | Yes |
| 25 | Atp8b1 | 16359 | -0.234 | -0.2793 | Yes |
| 26 | Adam10 | 18051 | -0.334 | -0.3247 | Yes |
| 27 | Ghrl | 18073 | -0.336 | -0.2863 | Yes |
| 28 | Rhcg | 18401 | -0.364 | -0.2599 | Yes |
| 29 | Rtn4rl1 | 18687 | -0.393 | -0.2280 | Yes |
| 30 | Scube1 | 18827 | -0.407 | -0.1871 | Yes |
| 31 | Thy1 | 19374 | -0.480 | -0.1580 | Yes |
| 32 | Pkhd1 | 19456 | -0.497 | -0.1036 | Yes |
| 33 | Flot2 | 19663 | -0.553 | -0.0489 | Yes |
| 34 | App | 19712 | -0.570 | 0.0157 | Yes |