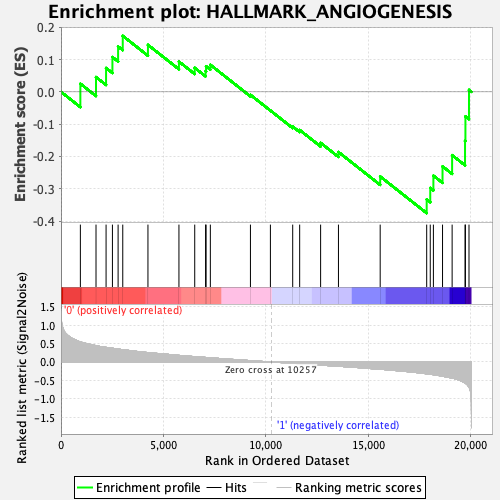
Profile of the Running ES Score & Positions of GeneSet Members on the Rank Ordered List
| Dataset | GMP.GMP.neu_Pheno.cls #Group1_versus_Group2.GMP.neu_Pheno.cls #Group1_versus_Group2_repos |
| Phenotype | GMP.neu_Pheno.cls#Group1_versus_Group2_repos |
| Upregulated in class | 1 |
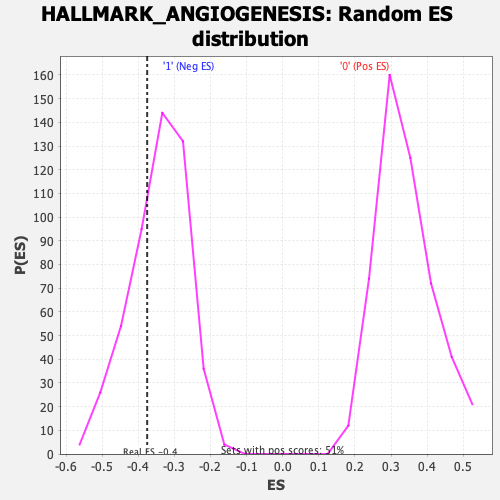
| GeneSet | HALLMARK_ANGIOGENESIS |
| Enrichment Score (ES) | -0.37533495 |
| Normalized Enrichment Score (NES) | -1.0900598 |
| Nominal p-value | 0.3151515 |
| FDR q-value | 0.61961085 |
| FWER p-Value | 0.978 |
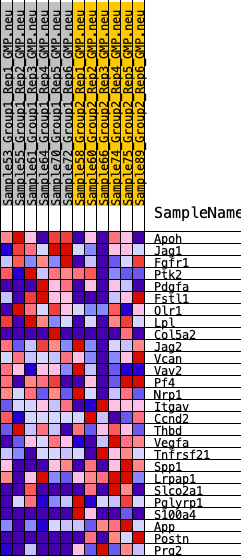
| SYMBOL | RANK IN GENE LIST | RANK METRIC SCORE | RUNNING ES | CORE ENRICHMENT | |
|---|---|---|---|---|---|
| 1 | Apoh | 945 | 0.544 | 0.0251 | No |
| 2 | Jag1 | 1708 | 0.441 | 0.0457 | No |
| 3 | Fgfr1 | 2199 | 0.395 | 0.0738 | No |
| 4 | Ptk2 | 2509 | 0.371 | 0.1076 | No |
| 5 | Pdgfa | 2786 | 0.350 | 0.1403 | No |
| 6 | Fstl1 | 3013 | 0.333 | 0.1732 | No |
| 7 | Olr1 | 4242 | 0.253 | 0.1454 | No |
| 8 | Lpl | 5754 | 0.178 | 0.0936 | No |
| 9 | Col5a2 | 6524 | 0.144 | 0.0743 | No |
| 10 | Jag2 | 7053 | 0.122 | 0.0641 | No |
| 11 | Vcan | 7078 | 0.121 | 0.0790 | No |
| 12 | Vav2 | 7286 | 0.113 | 0.0837 | No |
| 13 | Pf4 | 9242 | 0.036 | -0.0093 | No |
| 14 | Nrp1 | 10216 | 0.001 | -0.0578 | No |
| 15 | Itgav | 11304 | -0.036 | -0.1074 | No |
| 16 | Ccnd2 | 11644 | -0.047 | -0.1181 | No |
| 17 | Thbd | 12666 | -0.084 | -0.1579 | No |
| 18 | Vegfa | 13536 | -0.114 | -0.1862 | No |
| 19 | Tnfrsf21 | 15572 | -0.196 | -0.2619 | No |
| 20 | Spp1 | 17841 | -0.320 | -0.3328 | Yes |
| 21 | Lrpap1 | 18015 | -0.332 | -0.2974 | Yes |
| 22 | Slco2a1 | 18168 | -0.343 | -0.2594 | Yes |
| 23 | Pglyrp1 | 18614 | -0.384 | -0.2306 | Yes |
| 24 | S100a4 | 19082 | -0.436 | -0.1960 | Yes |
| 25 | App | 19712 | -0.570 | -0.1516 | Yes |
| 26 | Postn | 19731 | -0.576 | -0.0759 | Yes |
| 27 | Prg2 | 19905 | -0.681 | 0.0060 | Yes |