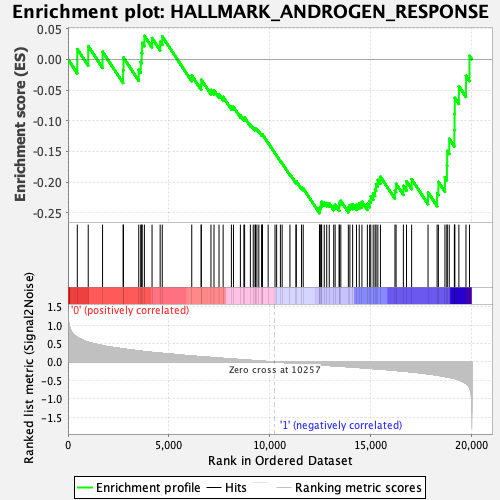
Profile of the Running ES Score & Positions of GeneSet Members on the Rank Ordered List
| Dataset | GMP.GMP.neu_Pheno.cls #Group1_versus_Group2.GMP.neu_Pheno.cls #Group1_versus_Group2_repos |
| Phenotype | GMP.neu_Pheno.cls#Group1_versus_Group2_repos |
| Upregulated in class | 1 |
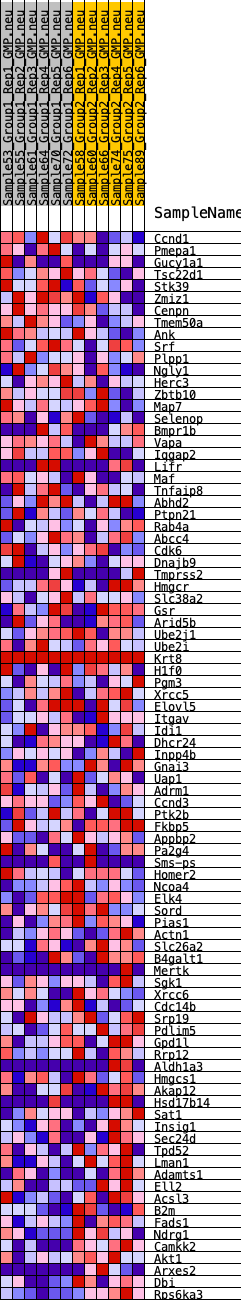
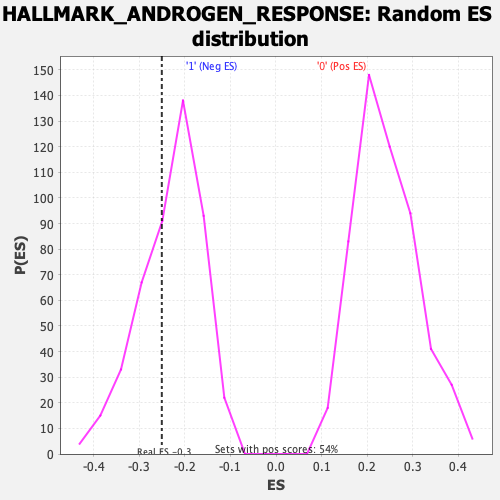
| GeneSet | HALLMARK_ANDROGEN_RESPONSE |
| Enrichment Score (ES) | -0.25038797 |
| Normalized Enrichment Score (NES) | -1.0827348 |
| Nominal p-value | 0.34557235 |
| FDR q-value | 0.6007384 |
| FWER p-Value | 0.98 |
| SYMBOL | RANK IN GENE LIST | RANK METRIC SCORE | RUNNING ES | CORE ENRICHMENT | |
|---|---|---|---|---|---|
| 1 | Ccnd1 | 461 | 0.663 | 0.0166 | No |
| 2 | Pmepa1 | 1003 | 0.534 | 0.0215 | No |
| 3 | Gucy1a1 | 1714 | 0.441 | 0.0124 | No |
| 4 | Tsc22d1 | 2732 | 0.355 | -0.0174 | No |
| 5 | Stk39 | 2752 | 0.353 | 0.0028 | No |
| 6 | Zmiz1 | 3509 | 0.300 | -0.0171 | No |
| 7 | Cenpn | 3607 | 0.293 | -0.0043 | No |
| 8 | Tmem50a | 3653 | 0.290 | 0.0108 | No |
| 9 | Ank | 3678 | 0.288 | 0.0268 | No |
| 10 | Srf | 3788 | 0.279 | 0.0381 | No |
| 11 | Plpp1 | 4168 | 0.258 | 0.0345 | No |
| 12 | Ngly1 | 4570 | 0.236 | 0.0286 | No |
| 13 | Herc3 | 4674 | 0.232 | 0.0373 | No |
| 14 | Zbtb10 | 6137 | 0.160 | -0.0264 | No |
| 15 | Map7 | 6604 | 0.141 | -0.0413 | No |
| 16 | Selenop | 6609 | 0.141 | -0.0330 | No |
| 17 | Bmpr1b | 7090 | 0.121 | -0.0499 | No |
| 18 | Vapa | 7240 | 0.115 | -0.0504 | No |
| 19 | Iqgap2 | 7489 | 0.104 | -0.0567 | No |
| 20 | Lifr | 7693 | 0.096 | -0.0611 | No |
| 21 | Maf | 8103 | 0.079 | -0.0769 | No |
| 22 | Tnfaip8 | 8206 | 0.075 | -0.0775 | No |
| 23 | Abhd2 | 8549 | 0.062 | -0.0909 | No |
| 24 | Ptpn21 | 8723 | 0.056 | -0.0962 | No |
| 25 | Rab4a | 8758 | 0.055 | -0.0947 | No |
| 26 | Abcc4 | 9044 | 0.044 | -0.1063 | No |
| 27 | Cdk6 | 9186 | 0.038 | -0.1112 | No |
| 28 | Dnajb9 | 9274 | 0.034 | -0.1135 | No |
| 29 | Tmprss2 | 9299 | 0.033 | -0.1127 | No |
| 30 | Hmgcr | 9368 | 0.031 | -0.1142 | No |
| 31 | Slc38a2 | 9464 | 0.027 | -0.1174 | No |
| 32 | Gsr | 9601 | 0.022 | -0.1228 | No |
| 33 | Arid5b | 9638 | 0.021 | -0.1234 | No |
| 34 | Ube2j1 | 9645 | 0.021 | -0.1224 | No |
| 35 | Ube2i | 9926 | 0.010 | -0.1358 | No |
| 36 | Krt8 | 10267 | 0.000 | -0.1529 | No |
| 37 | H1f0 | 10347 | -0.002 | -0.1567 | No |
| 38 | Pgm3 | 10533 | -0.008 | -0.1655 | No |
| 39 | Xrcc5 | 10620 | -0.011 | -0.1692 | No |
| 40 | Elovl5 | 11007 | -0.025 | -0.1871 | No |
| 41 | Itgav | 11304 | -0.036 | -0.1998 | No |
| 42 | Idi1 | 11320 | -0.036 | -0.1984 | No |
| 43 | Dhcr24 | 11581 | -0.045 | -0.2087 | No |
| 44 | Inpp4b | 11665 | -0.048 | -0.2100 | No |
| 45 | Gnai3 | 12471 | -0.077 | -0.2458 | Yes |
| 46 | Uap1 | 12481 | -0.077 | -0.2416 | Yes |
| 47 | Adrm1 | 12533 | -0.079 | -0.2394 | Yes |
| 48 | Ccnd3 | 12562 | -0.080 | -0.2360 | Yes |
| 49 | Ptk2b | 12579 | -0.081 | -0.2319 | Yes |
| 50 | Fkbp5 | 12708 | -0.086 | -0.2332 | Yes |
| 51 | Appbp2 | 12831 | -0.091 | -0.2339 | Yes |
| 52 | Pa2g4 | 12956 | -0.094 | -0.2345 | Yes |
| 53 | Sms-ps | 13178 | -0.103 | -0.2394 | Yes |
| 54 | Homer2 | 13248 | -0.105 | -0.2365 | Yes |
| 55 | Ncoa4 | 13451 | -0.111 | -0.2400 | Yes |
| 56 | Elk4 | 13453 | -0.111 | -0.2334 | Yes |
| 57 | Sord | 13530 | -0.114 | -0.2303 | Yes |
| 58 | Pias1 | 13903 | -0.129 | -0.2413 | Yes |
| 59 | Actn1 | 13980 | -0.131 | -0.2372 | Yes |
| 60 | Slc26a2 | 14116 | -0.137 | -0.2358 | Yes |
| 61 | B4galt1 | 14306 | -0.144 | -0.2366 | Yes |
| 62 | Mertk | 14443 | -0.150 | -0.2345 | Yes |
| 63 | Sgk1 | 14577 | -0.156 | -0.2318 | Yes |
| 64 | Xrcc6 | 14846 | -0.167 | -0.2352 | Yes |
| 65 | Cdc14b | 14960 | -0.172 | -0.2306 | Yes |
| 66 | Srp19 | 15016 | -0.174 | -0.2229 | Yes |
| 67 | Pdlim5 | 15135 | -0.179 | -0.2181 | Yes |
| 68 | Gpd1l | 15227 | -0.182 | -0.2117 | Yes |
| 69 | Rrp12 | 15277 | -0.185 | -0.2031 | Yes |
| 70 | Aldh1a3 | 15366 | -0.189 | -0.1962 | Yes |
| 71 | Hmgcs1 | 15494 | -0.192 | -0.1910 | Yes |
| 72 | Akap12 | 16215 | -0.226 | -0.2136 | Yes |
| 73 | Hsd17b14 | 16270 | -0.228 | -0.2026 | Yes |
| 74 | Sat1 | 16632 | -0.245 | -0.2060 | Yes |
| 75 | Insig1 | 16788 | -0.254 | -0.1985 | Yes |
| 76 | Sec24d | 17042 | -0.269 | -0.1951 | Yes |
| 77 | Tpd52 | 17855 | -0.321 | -0.2166 | Yes |
| 78 | Lman1 | 18305 | -0.354 | -0.2179 | Yes |
| 79 | Adamts1 | 18368 | -0.360 | -0.1994 | Yes |
| 80 | Ell2 | 18693 | -0.393 | -0.1920 | Yes |
| 81 | Acsl3 | 18792 | -0.404 | -0.1727 | Yes |
| 82 | B2m | 18805 | -0.404 | -0.1491 | Yes |
| 83 | Fads1 | 18907 | -0.416 | -0.1292 | Yes |
| 84 | Ndrg1 | 19161 | -0.444 | -0.1153 | Yes |
| 85 | Camkk2 | 19171 | -0.446 | -0.0890 | Yes |
| 86 | Akt1 | 19183 | -0.448 | -0.0627 | Yes |
| 87 | Arxes2 | 19385 | -0.483 | -0.0438 | Yes |
| 88 | Dbi | 19737 | -0.577 | -0.0268 | Yes |
| 89 | Rps6ka3 | 19911 | -0.688 | 0.0058 | Yes |