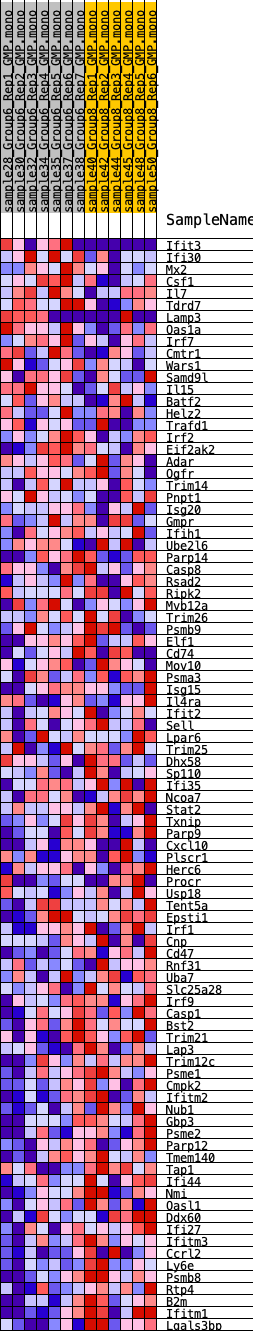
Profile of the Running ES Score & Positions of GeneSet Members on the Rank Ordered List
| Dataset | GMP.GMP.mono_Pheno.cls #Group6_versus_Group8.GMP.mono_Pheno.cls #Group6_versus_Group8_repos |
| Phenotype | GMP.mono_Pheno.cls#Group6_versus_Group8_repos |
| Upregulated in class | 5 |
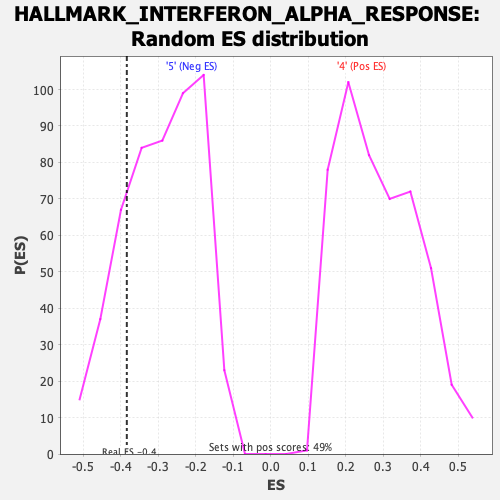
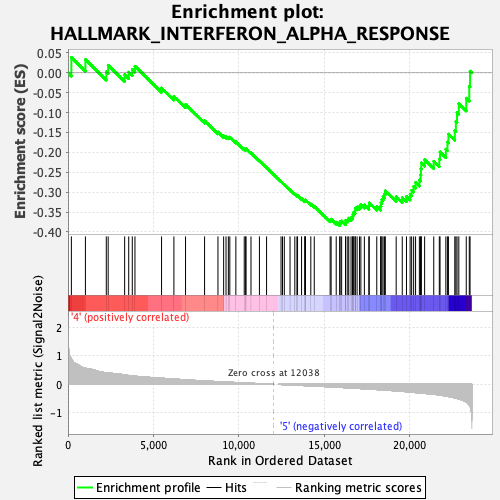
| GeneSet | HALLMARK_INTERFERON_ALPHA_RESPONSE |
| Enrichment Score (ES) | -0.38417146 |
| Normalized Enrichment Score (NES) | -1.3245934 |
| Nominal p-value | 0.19417475 |
| FDR q-value | 0.40775836 |
| FWER p-Value | 0.744 |
| SYMBOL | RANK IN GENE LIST | RANK METRIC SCORE | RUNNING ES | CORE ENRICHMENT | |
|---|---|---|---|---|---|
| 1 | Ifit3 | 197 | 0.902 | 0.0388 | No |
| 2 | Ifi30 | 1019 | 0.567 | 0.0335 | No |
| 3 | Mx2 | 2240 | 0.405 | 0.0028 | No |
| 4 | Csf1 | 2350 | 0.401 | 0.0192 | No |
| 5 | Il7 | 3314 | 0.332 | -0.0044 | No |
| 6 | Tdrd7 | 3552 | 0.311 | 0.0018 | No |
| 7 | Lamp3 | 3761 | 0.297 | 0.0085 | No |
| 8 | Oas1a | 3917 | 0.285 | 0.0168 | No |
| 9 | Irf7 | 5473 | 0.216 | -0.0380 | No |
| 10 | Cmtr1 | 6195 | 0.187 | -0.0589 | No |
| 11 | Wars1 | 6876 | 0.160 | -0.0794 | No |
| 12 | Samd9l | 7990 | 0.118 | -0.1205 | No |
| 13 | Il15 | 8773 | 0.094 | -0.1489 | No |
| 14 | Batf2 | 9105 | 0.085 | -0.1585 | No |
| 15 | Helz2 | 9245 | 0.081 | -0.1602 | No |
| 16 | Trafd1 | 9381 | 0.076 | -0.1619 | No |
| 17 | Irf2 | 9467 | 0.074 | -0.1617 | No |
| 18 | Eif2ak2 | 9820 | 0.064 | -0.1733 | No |
| 19 | Adar | 10310 | 0.049 | -0.1915 | No |
| 20 | Ogfr | 10391 | 0.047 | -0.1925 | No |
| 21 | Trim14 | 10414 | 0.046 | -0.1910 | No |
| 22 | Pnpt1 | 10705 | 0.039 | -0.2013 | No |
| 23 | Isg20 | 11199 | 0.024 | -0.2210 | No |
| 24 | Gmpr | 11617 | 0.012 | -0.2381 | No |
| 25 | Ifih1 | 12463 | -0.004 | -0.2738 | No |
| 26 | Ube2l6 | 12548 | -0.006 | -0.2770 | No |
| 27 | Parp14 | 12654 | -0.008 | -0.2810 | No |
| 28 | Casp8 | 12989 | -0.018 | -0.2943 | No |
| 29 | Rsad2 | 13269 | -0.026 | -0.3048 | No |
| 30 | Ripk2 | 13393 | -0.029 | -0.3085 | No |
| 31 | Mvb12a | 13430 | -0.029 | -0.3085 | No |
| 32 | Trim26 | 13664 | -0.037 | -0.3165 | No |
| 33 | Psmb9 | 13851 | -0.042 | -0.3222 | No |
| 34 | Elf1 | 13871 | -0.043 | -0.3208 | No |
| 35 | Cd74 | 13892 | -0.043 | -0.3193 | No |
| 36 | Mov10 | 14205 | -0.053 | -0.3299 | No |
| 37 | Psma3 | 14407 | -0.058 | -0.3354 | No |
| 38 | Isg15 | 15336 | -0.087 | -0.3702 | No |
| 39 | Il4ra | 15393 | -0.089 | -0.3680 | No |
| 40 | Ifit2 | 15691 | -0.097 | -0.3755 | No |
| 41 | Sell | 15896 | -0.103 | -0.3788 | Yes |
| 42 | Lpar6 | 15917 | -0.104 | -0.3742 | Yes |
| 43 | Trim25 | 16009 | -0.107 | -0.3724 | Yes |
| 44 | Dhx58 | 16241 | -0.115 | -0.3763 | Yes |
| 45 | Sp110 | 16248 | -0.115 | -0.3705 | Yes |
| 46 | Ifi35 | 16369 | -0.119 | -0.3694 | Yes |
| 47 | Ncoa7 | 16426 | -0.121 | -0.3654 | Yes |
| 48 | Stat2 | 16559 | -0.127 | -0.3644 | Yes |
| 49 | Txnip | 16646 | -0.130 | -0.3613 | Yes |
| 50 | Parp9 | 16672 | -0.131 | -0.3555 | Yes |
| 51 | Cxcl10 | 16716 | -0.132 | -0.3504 | Yes |
| 52 | Plscr1 | 16799 | -0.135 | -0.3469 | Yes |
| 53 | Herc6 | 16802 | -0.135 | -0.3399 | Yes |
| 54 | Procr | 16913 | -0.139 | -0.3374 | Yes |
| 55 | Usp18 | 17055 | -0.144 | -0.3359 | Yes |
| 56 | Tent5a | 17134 | -0.147 | -0.3315 | Yes |
| 57 | Epsti1 | 17338 | -0.154 | -0.3320 | Yes |
| 58 | Irf1 | 17602 | -0.164 | -0.3346 | Yes |
| 59 | Cnp | 17622 | -0.165 | -0.3268 | Yes |
| 60 | Cd47 | 18064 | -0.181 | -0.3361 | Yes |
| 61 | Rnf31 | 18289 | -0.189 | -0.3358 | Yes |
| 62 | Uba7 | 18313 | -0.189 | -0.3269 | Yes |
| 63 | Slc25a28 | 18363 | -0.191 | -0.3189 | Yes |
| 64 | Irf9 | 18431 | -0.195 | -0.3116 | Yes |
| 65 | Casp1 | 18513 | -0.198 | -0.3047 | Yes |
| 66 | Bst2 | 18564 | -0.200 | -0.2963 | Yes |
| 67 | Trim21 | 19199 | -0.226 | -0.3114 | Yes |
| 68 | Lap3 | 19555 | -0.243 | -0.3138 | Yes |
| 69 | Trim12c | 19802 | -0.257 | -0.3109 | Yes |
| 70 | Psme1 | 20015 | -0.268 | -0.3059 | Yes |
| 71 | Cmpk2 | 20104 | -0.274 | -0.2953 | Yes |
| 72 | Ifitm2 | 20220 | -0.280 | -0.2856 | Yes |
| 73 | Nub1 | 20334 | -0.287 | -0.2754 | Yes |
| 74 | Gbp3 | 20556 | -0.298 | -0.2692 | Yes |
| 75 | Psme2 | 20627 | -0.302 | -0.2564 | Yes |
| 76 | Parp12 | 20649 | -0.303 | -0.2415 | Yes |
| 77 | Tmem140 | 20668 | -0.304 | -0.2263 | Yes |
| 78 | Tap1 | 20864 | -0.317 | -0.2180 | Yes |
| 79 | Ifi44 | 21397 | -0.350 | -0.2223 | Yes |
| 80 | Nmi | 21722 | -0.371 | -0.2167 | Yes |
| 81 | Oasl1 | 21765 | -0.375 | -0.1989 | Yes |
| 82 | Ddx60 | 22105 | -0.408 | -0.1920 | Yes |
| 83 | Ifi27 | 22197 | -0.419 | -0.1739 | Yes |
| 84 | Ifitm3 | 22256 | -0.425 | -0.1542 | Yes |
| 85 | Ccrl2 | 22628 | -0.474 | -0.1452 | Yes |
| 86 | Ly6e | 22692 | -0.481 | -0.1227 | Yes |
| 87 | Psmb8 | 22759 | -0.492 | -0.0998 | Yes |
| 88 | Rtp4 | 22864 | -0.509 | -0.0776 | Yes |
| 89 | B2m | 23299 | -0.618 | -0.0637 | Yes |
| 90 | Ifitm1 | 23476 | -0.718 | -0.0337 | Yes |
| 91 | Lgals3bp | 23521 | -0.763 | 0.0044 | Yes |