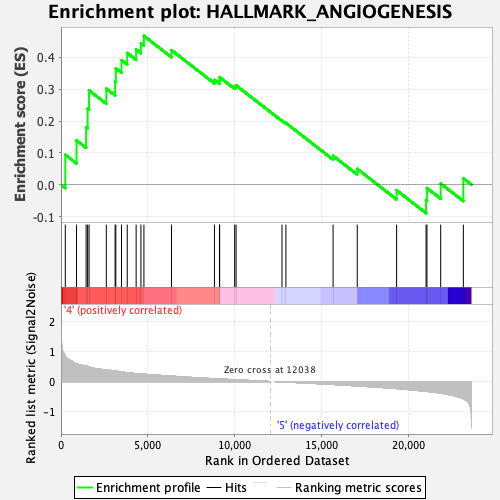
Profile of the Running ES Score & Positions of GeneSet Members on the Rank Ordered List
| Dataset | GMP.GMP.mono_Pheno.cls #Group6_versus_Group8.GMP.mono_Pheno.cls #Group6_versus_Group8_repos |
| Phenotype | GMP.mono_Pheno.cls#Group6_versus_Group8_repos |
| Upregulated in class | 4 |
| GeneSet | HALLMARK_ANGIOGENESIS |
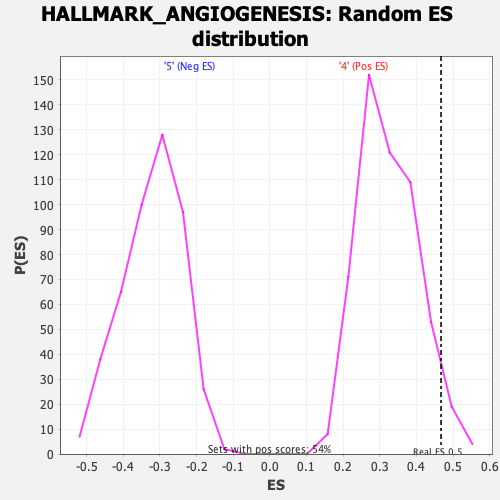
| Enrichment Score (ES) | 0.4673349 |
| Normalized Enrichment Score (NES) | 1.4428884 |
| Nominal p-value | 0.04283054 |
| FDR q-value | 0.41513342 |
| FWER p-Value | 0.484 |
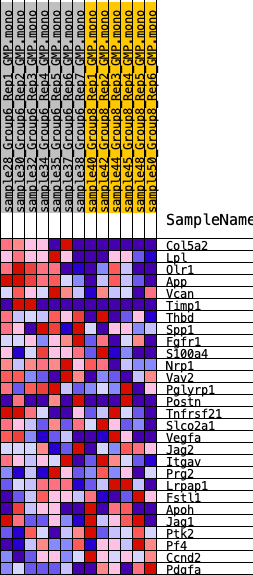
| SYMBOL | RANK IN GENE LIST | RANK METRIC SCORE | RUNNING ES | CORE ENRICHMENT | |
|---|---|---|---|---|---|
| 1 | Col5a2 | 247 | 0.842 | 0.0943 | Yes |
| 2 | Lpl | 893 | 0.581 | 0.1392 | Yes |
| 3 | Olr1 | 1445 | 0.519 | 0.1804 | Yes |
| 4 | App | 1532 | 0.502 | 0.2393 | Yes |
| 5 | Vcan | 1615 | 0.485 | 0.2962 | Yes |
| 6 | Timp1 | 2608 | 0.382 | 0.3017 | Yes |
| 7 | Thbd | 3114 | 0.351 | 0.3240 | Yes |
| 8 | Spp1 | 3155 | 0.347 | 0.3654 | Yes |
| 9 | Fgfr1 | 3482 | 0.316 | 0.3910 | Yes |
| 10 | S100a4 | 3812 | 0.293 | 0.4135 | Yes |
| 11 | Nrp1 | 4324 | 0.264 | 0.4247 | Yes |
| 12 | Vav2 | 4600 | 0.250 | 0.4442 | Yes |
| 13 | Pglyrp1 | 4772 | 0.244 | 0.4673 | Yes |
| 14 | Postn | 6360 | 0.179 | 0.4224 | No |
| 15 | Tnfrsf21 | 8831 | 0.092 | 0.3292 | No |
| 16 | Slco2a1 | 9120 | 0.084 | 0.3275 | No |
| 17 | Vegfa | 9131 | 0.084 | 0.3375 | No |
| 18 | Jag2 | 9994 | 0.059 | 0.3083 | No |
| 19 | Itgav | 10076 | 0.056 | 0.3119 | No |
| 20 | Prg2 | 12719 | -0.010 | 0.2012 | No |
| 21 | Lrpap1 | 12943 | -0.017 | 0.1938 | No |
| 22 | Fstl1 | 15659 | -0.096 | 0.0908 | No |
| 23 | Apoh | 17050 | -0.144 | 0.0497 | No |
| 24 | Jag1 | 19315 | -0.232 | -0.0174 | No |
| 25 | Ptk2 | 21011 | -0.323 | -0.0490 | No |
| 26 | Pf4 | 21062 | -0.327 | -0.0104 | No |
| 27 | Ccnd2 | 21852 | -0.384 | 0.0039 | No |
| 28 | Pdgfa | 23156 | -0.572 | 0.0198 | No |