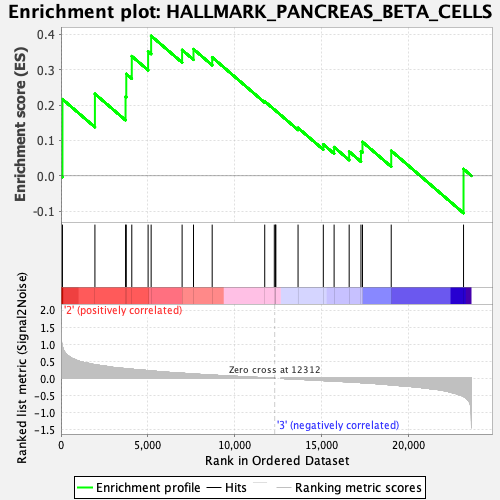
Profile of the Running ES Score & Positions of GeneSet Members on the Rank Ordered List
| Dataset | GMP.GMP.mono_Pheno.cls #Group3_versus_Group4.GMP.mono_Pheno.cls #Group3_versus_Group4_repos |
| Phenotype | GMP.mono_Pheno.cls#Group3_versus_Group4_repos |
| Upregulated in class | 2 |
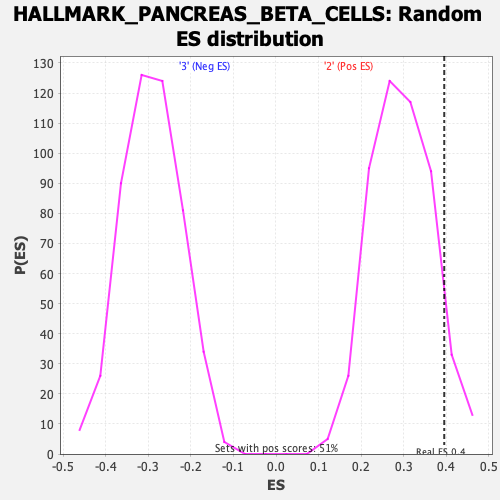
| GeneSet | HALLMARK_PANCREAS_BETA_CELLS |
| Enrichment Score (ES) | 0.39558077 |
| Normalized Enrichment Score (NES) | 1.3402212 |
| Nominal p-value | 0.084812626 |
| FDR q-value | 0.7346776 |
| FWER p-Value | 0.72 |
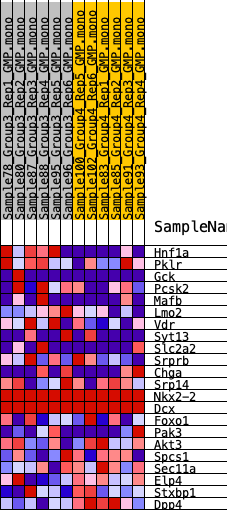
| SYMBOL | RANK IN GENE LIST | RANK METRIC SCORE | RUNNING ES | CORE ENRICHMENT | |
|---|---|---|---|---|---|
| 1 | Hnf1a | 84 | 0.924 | 0.2166 | Yes |
| 2 | Pklr | 1952 | 0.395 | 0.2318 | Yes |
| 3 | Gck | 3715 | 0.279 | 0.2237 | Yes |
| 4 | Pcsk2 | 3757 | 0.277 | 0.2880 | Yes |
| 5 | Mafb | 4074 | 0.267 | 0.3383 | Yes |
| 6 | Lmo2 | 5013 | 0.223 | 0.3516 | Yes |
| 7 | Vdr | 5188 | 0.215 | 0.3956 | Yes |
| 8 | Syt13 | 6970 | 0.150 | 0.3558 | No |
| 9 | Slc2a2 | 7626 | 0.126 | 0.3581 | No |
| 10 | Srprb | 8701 | 0.094 | 0.3350 | No |
| 11 | Chga | 11725 | 0.015 | 0.2105 | No |
| 12 | Srp14 | 12276 | 0.001 | 0.1874 | No |
| 13 | Nkx2-2 | 12348 | 0.000 | 0.1844 | No |
| 14 | Dcx | 12364 | 0.000 | 0.1838 | No |
| 15 | Foxo1 | 13643 | -0.025 | 0.1356 | No |
| 16 | Pak3 | 15097 | -0.062 | 0.0889 | No |
| 17 | Akt3 | 15718 | -0.078 | 0.0812 | No |
| 18 | Spcs1 | 16585 | -0.101 | 0.0686 | No |
| 19 | Sec11a | 17263 | -0.124 | 0.0694 | No |
| 20 | Elp4 | 17351 | -0.127 | 0.0959 | No |
| 21 | Stxbp1 | 19005 | -0.189 | 0.0708 | No |
| 22 | Dpp4 | 23167 | -0.524 | 0.0194 | No |