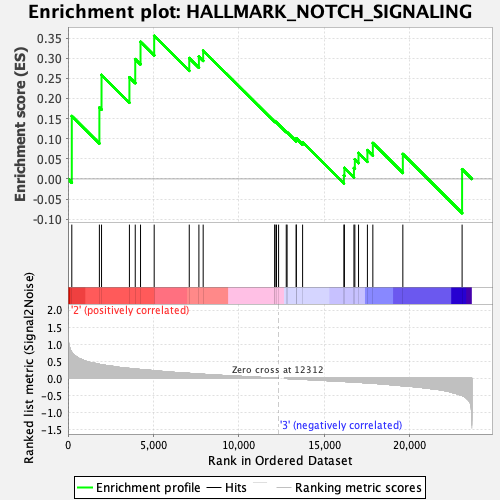
Profile of the Running ES Score & Positions of GeneSet Members on the Rank Ordered List
| Dataset | GMP.GMP.mono_Pheno.cls #Group3_versus_Group4.GMP.mono_Pheno.cls #Group3_versus_Group4_repos |
| Phenotype | GMP.mono_Pheno.cls#Group3_versus_Group4_repos |
| Upregulated in class | 2 |
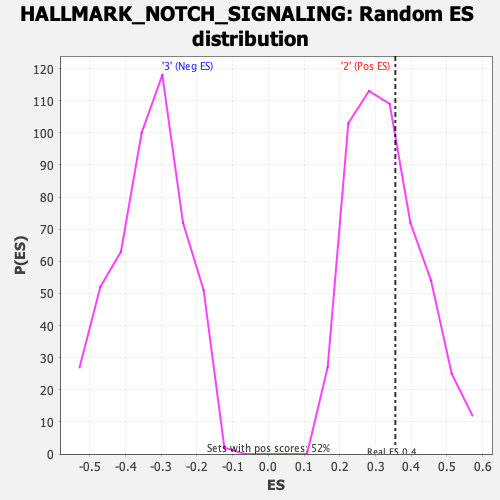
| GeneSet | HALLMARK_NOTCH_SIGNALING |
| Enrichment Score (ES) | 0.35543945 |
| Normalized Enrichment Score (NES) | 1.0763329 |
| Nominal p-value | 0.38252428 |
| FDR q-value | 1.0 |
| FWER p-Value | 0.973 |
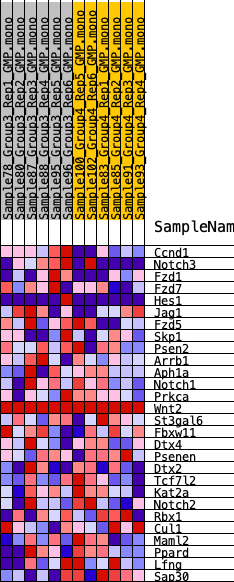
| SYMBOL | RANK IN GENE LIST | RANK METRIC SCORE | RUNNING ES | CORE ENRICHMENT | |
|---|---|---|---|---|---|
| 1 | Ccnd1 | 222 | 0.756 | 0.1562 | Yes |
| 2 | Notch3 | 1836 | 0.409 | 0.1774 | Yes |
| 3 | Fzd1 | 1962 | 0.394 | 0.2584 | Yes |
| 4 | Fzd7 | 3593 | 0.288 | 0.2525 | Yes |
| 5 | Hes1 | 3934 | 0.271 | 0.2976 | Yes |
| 6 | Jag1 | 4243 | 0.256 | 0.3407 | Yes |
| 7 | Fzd5 | 5042 | 0.222 | 0.3554 | Yes |
| 8 | Skp1 | 7094 | 0.145 | 0.3003 | No |
| 9 | Psen2 | 7658 | 0.125 | 0.3038 | No |
| 10 | Arrb1 | 7908 | 0.117 | 0.3190 | No |
| 11 | Aph1a | 12094 | 0.006 | 0.1429 | No |
| 12 | Notch1 | 12109 | 0.006 | 0.1436 | No |
| 13 | Prkca | 12198 | 0.003 | 0.1404 | No |
| 14 | Wnt2 | 12320 | 0.000 | 0.1353 | No |
| 15 | St3gal6 | 12768 | -0.003 | 0.1170 | No |
| 16 | Fbxw11 | 12817 | -0.004 | 0.1159 | No |
| 17 | Dtx4 | 13352 | -0.017 | 0.0971 | No |
| 18 | Psenen | 13354 | -0.017 | 0.1009 | No |
| 19 | Dtx2 | 13725 | -0.027 | 0.0911 | No |
| 20 | Tcf7l2 | 16140 | -0.091 | 0.0086 | No |
| 21 | Kat2a | 16171 | -0.091 | 0.0274 | No |
| 22 | Notch2 | 16728 | -0.106 | 0.0271 | No |
| 23 | Rbx1 | 16782 | -0.108 | 0.0484 | No |
| 24 | Cul1 | 16997 | -0.115 | 0.0645 | No |
| 25 | Maml2 | 17516 | -0.132 | 0.0715 | No |
| 26 | Ppard | 17834 | -0.142 | 0.0892 | No |
| 27 | Lfng | 19589 | -0.215 | 0.0619 | No |
| 28 | Sap30 | 23056 | -0.498 | 0.0241 | No |