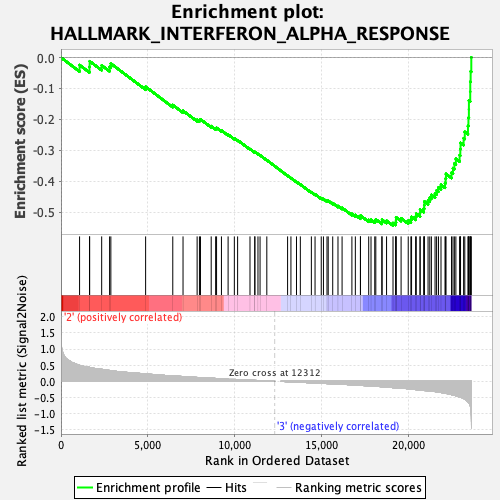
Profile of the Running ES Score & Positions of GeneSet Members on the Rank Ordered List
| Dataset | GMP.GMP.mono_Pheno.cls #Group3_versus_Group4.GMP.mono_Pheno.cls #Group3_versus_Group4_repos |
| Phenotype | GMP.mono_Pheno.cls#Group3_versus_Group4_repos |
| Upregulated in class | 3 |
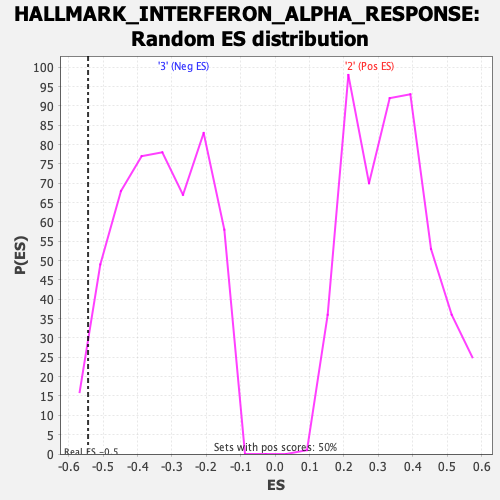
| GeneSet | HALLMARK_INTERFERON_ALPHA_RESPONSE |
| Enrichment Score (ES) | -0.54380447 |
| Normalized Enrichment Score (NES) | -1.6366441 |
| Nominal p-value | 0.024193548 |
| FDR q-value | 0.31349322 |
| FWER p-Value | 0.194 |
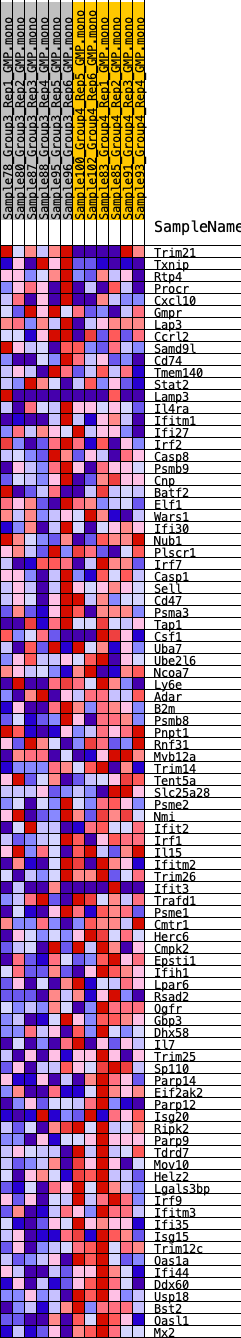
| SYMBOL | RANK IN GENE LIST | RANK METRIC SCORE | RUNNING ES | CORE ENRICHMENT | |
|---|---|---|---|---|---|
| 1 | Trim21 | 1069 | 0.495 | -0.0242 | No |
| 2 | Txnip | 1640 | 0.431 | -0.0300 | No |
| 3 | Rtp4 | 1650 | 0.430 | -0.0120 | No |
| 4 | Procr | 2341 | 0.372 | -0.0254 | No |
| 5 | Cxcl10 | 2797 | 0.335 | -0.0304 | No |
| 6 | Gmpr | 2869 | 0.328 | -0.0193 | No |
| 7 | Lap3 | 4870 | 0.230 | -0.0945 | No |
| 8 | Ccrl2 | 6433 | 0.171 | -0.1535 | No |
| 9 | Samd9l | 7023 | 0.148 | -0.1722 | No |
| 10 | Cd74 | 7834 | 0.120 | -0.2015 | No |
| 11 | Tmem140 | 7968 | 0.115 | -0.2022 | No |
| 12 | Stat2 | 8027 | 0.113 | -0.1998 | No |
| 13 | Lamp3 | 8644 | 0.096 | -0.2219 | No |
| 14 | Il4ra | 8900 | 0.088 | -0.2289 | No |
| 15 | Ifitm1 | 8953 | 0.087 | -0.2274 | No |
| 16 | Ifi27 | 9234 | 0.080 | -0.2359 | No |
| 17 | Irf2 | 9617 | 0.070 | -0.2492 | No |
| 18 | Casp8 | 9976 | 0.060 | -0.2618 | No |
| 19 | Psmb9 | 10165 | 0.055 | -0.2674 | No |
| 20 | Cnp | 10877 | 0.037 | -0.2961 | No |
| 21 | Batf2 | 11153 | 0.029 | -0.3065 | No |
| 22 | Elf1 | 11157 | 0.029 | -0.3054 | No |
| 23 | Wars1 | 11336 | 0.025 | -0.3119 | No |
| 24 | Ifi30 | 11456 | 0.022 | -0.3160 | No |
| 25 | Nub1 | 11845 | 0.012 | -0.3320 | No |
| 26 | Plscr1 | 13041 | -0.010 | -0.3824 | No |
| 27 | Irf7 | 13233 | -0.015 | -0.3899 | No |
| 28 | Casp1 | 13553 | -0.023 | -0.4024 | No |
| 29 | Sell | 13774 | -0.028 | -0.4106 | No |
| 30 | Cd47 | 14409 | -0.044 | -0.4356 | No |
| 31 | Psma3 | 14621 | -0.050 | -0.4425 | No |
| 32 | Tap1 | 14978 | -0.059 | -0.4551 | No |
| 33 | Csf1 | 15104 | -0.063 | -0.4577 | No |
| 34 | Uba7 | 15309 | -0.068 | -0.4634 | No |
| 35 | Ube2l6 | 15379 | -0.069 | -0.4634 | No |
| 36 | Ncoa7 | 15638 | -0.076 | -0.4711 | No |
| 37 | Ly6e | 15941 | -0.084 | -0.4804 | No |
| 38 | Adar | 16177 | -0.092 | -0.4864 | No |
| 39 | B2m | 16742 | -0.107 | -0.5058 | No |
| 40 | Psmb8 | 16940 | -0.113 | -0.5093 | No |
| 41 | Pnpt1 | 17232 | -0.123 | -0.5165 | No |
| 42 | Rnf31 | 17236 | -0.123 | -0.5113 | No |
| 43 | Mvb12a | 17709 | -0.137 | -0.5255 | No |
| 44 | Trim14 | 17842 | -0.142 | -0.5250 | No |
| 45 | Tent5a | 18057 | -0.150 | -0.5277 | No |
| 46 | Slc25a28 | 18118 | -0.152 | -0.5237 | No |
| 47 | Psme2 | 18465 | -0.166 | -0.5313 | No |
| 48 | Nmi | 18479 | -0.166 | -0.5248 | No |
| 49 | Ifit2 | 18737 | -0.178 | -0.5281 | No |
| 50 | Irf1 | 19108 | -0.193 | -0.5355 | Yes |
| 51 | Il15 | 19259 | -0.200 | -0.5333 | Yes |
| 52 | Ifitm2 | 19282 | -0.201 | -0.5257 | Yes |
| 53 | Trim26 | 19286 | -0.201 | -0.5172 | Yes |
| 54 | Ifit3 | 19573 | -0.214 | -0.5202 | Yes |
| 55 | Trafd1 | 19984 | -0.228 | -0.5278 | Yes |
| 56 | Psme1 | 20138 | -0.237 | -0.5242 | Yes |
| 57 | Cmtr1 | 20176 | -0.239 | -0.5155 | Yes |
| 58 | Herc6 | 20409 | -0.254 | -0.5145 | Yes |
| 59 | Cmpk2 | 20446 | -0.255 | -0.5051 | Yes |
| 60 | Epsti1 | 20664 | -0.264 | -0.5030 | Yes |
| 61 | Ifih1 | 20668 | -0.264 | -0.4918 | Yes |
| 62 | Lpar6 | 20877 | -0.279 | -0.4887 | Yes |
| 63 | Rsad2 | 20906 | -0.282 | -0.4778 | Yes |
| 64 | Ogfr | 20913 | -0.283 | -0.4659 | Yes |
| 65 | Gbp3 | 21125 | -0.293 | -0.4623 | Yes |
| 66 | Dhx58 | 21225 | -0.300 | -0.4537 | Yes |
| 67 | Il7 | 21316 | -0.306 | -0.4444 | Yes |
| 68 | Trim25 | 21528 | -0.315 | -0.4399 | Yes |
| 69 | Sp110 | 21617 | -0.321 | -0.4299 | Yes |
| 70 | Parp14 | 21723 | -0.330 | -0.4202 | Yes |
| 71 | Eif2ak2 | 21870 | -0.343 | -0.4117 | Yes |
| 72 | Parp12 | 22102 | -0.365 | -0.4059 | Yes |
| 73 | Isg20 | 22136 | -0.369 | -0.3915 | Yes |
| 74 | Ripk2 | 22155 | -0.371 | -0.3764 | Yes |
| 75 | Parp9 | 22476 | -0.409 | -0.3724 | Yes |
| 76 | Tdrd7 | 22559 | -0.421 | -0.3579 | Yes |
| 77 | Mov10 | 22639 | -0.426 | -0.3430 | Yes |
| 78 | Helz2 | 22726 | -0.443 | -0.3277 | Yes |
| 79 | Lgals3bp | 22940 | -0.485 | -0.3160 | Yes |
| 80 | Irf9 | 22982 | -0.490 | -0.2967 | Yes |
| 81 | Ifitm3 | 22994 | -0.493 | -0.2761 | Yes |
| 82 | Ifi35 | 23172 | -0.525 | -0.2611 | Yes |
| 83 | Isg15 | 23239 | -0.549 | -0.2404 | Yes |
| 84 | Trim12c | 23422 | -0.629 | -0.2212 | Yes |
| 85 | Oas1a | 23449 | -0.643 | -0.1948 | Yes |
| 86 | Ifi44 | 23475 | -0.660 | -0.1675 | Yes |
| 87 | Ddx60 | 23477 | -0.661 | -0.1393 | Yes |
| 88 | Usp18 | 23552 | -0.745 | -0.1105 | Yes |
| 89 | Bst2 | 23555 | -0.755 | -0.0783 | Yes |
| 90 | Oasl1 | 23576 | -0.803 | -0.0447 | Yes |
| 91 | Mx2 | 23614 | -1.091 | 0.0004 | Yes |