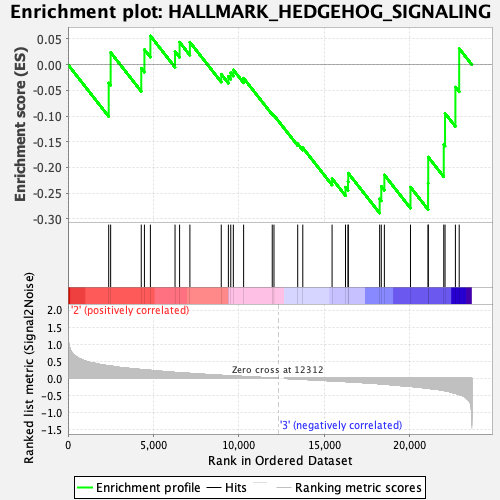
Profile of the Running ES Score & Positions of GeneSet Members on the Rank Ordered List
| Dataset | GMP.GMP.mono_Pheno.cls #Group3_versus_Group4.GMP.mono_Pheno.cls #Group3_versus_Group4_repos |
| Phenotype | GMP.mono_Pheno.cls#Group3_versus_Group4_repos |
| Upregulated in class | 3 |
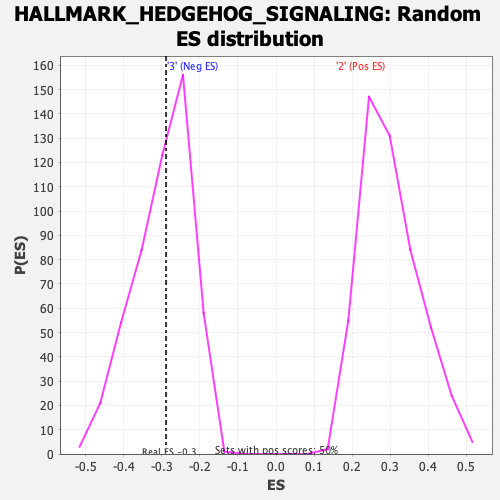
| GeneSet | HALLMARK_HEDGEHOG_SIGNALING |
| Enrichment Score (ES) | -0.2888631 |
| Normalized Enrichment Score (NES) | -0.9707365 |
| Nominal p-value | 0.486 |
| FDR q-value | 1.0 |
| FWER p-Value | 0.999 |
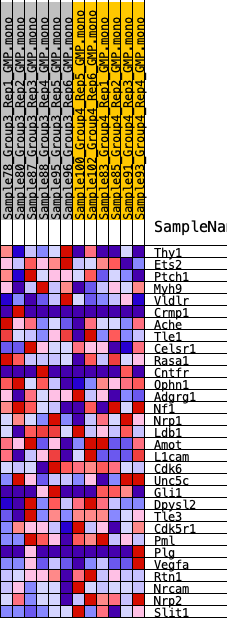
| SYMBOL | RANK IN GENE LIST | RANK METRIC SCORE | RUNNING ES | CORE ENRICHMENT | |
|---|---|---|---|---|---|
| 1 | Thy1 | 2381 | 0.368 | -0.0356 | No |
| 2 | Ets2 | 2495 | 0.361 | 0.0238 | No |
| 3 | Ptch1 | 4286 | 0.254 | -0.0069 | No |
| 4 | Myh9 | 4471 | 0.248 | 0.0293 | No |
| 5 | Vldlr | 4820 | 0.233 | 0.0560 | No |
| 6 | Crmp1 | 6262 | 0.171 | 0.0254 | No |
| 7 | Ache | 6528 | 0.167 | 0.0438 | No |
| 8 | Tle1 | 7131 | 0.143 | 0.0438 | No |
| 9 | Celsr1 | 8966 | 0.086 | -0.0186 | No |
| 10 | Rasa1 | 9383 | 0.075 | -0.0228 | No |
| 11 | Cntfr | 9522 | 0.072 | -0.0159 | No |
| 12 | Ophn1 | 9673 | 0.068 | -0.0101 | No |
| 13 | Adgrg1 | 10274 | 0.052 | -0.0263 | No |
| 14 | Nf1 | 11949 | 0.009 | -0.0956 | No |
| 15 | Nrp1 | 12050 | 0.007 | -0.0986 | No |
| 16 | Ldb1 | 13438 | -0.020 | -0.1539 | No |
| 17 | Amot | 13736 | -0.027 | -0.1617 | No |
| 18 | L1cam | 15449 | -0.071 | -0.2217 | No |
| 19 | Cdk6 | 16234 | -0.093 | -0.2384 | No |
| 20 | Unc5c | 16383 | -0.096 | -0.2276 | No |
| 21 | Gli1 | 16396 | -0.096 | -0.2110 | No |
| 22 | Dpysl2 | 18233 | -0.156 | -0.2611 | Yes |
| 23 | Tle3 | 18328 | -0.159 | -0.2367 | Yes |
| 24 | Cdk5r1 | 18508 | -0.167 | -0.2145 | Yes |
| 25 | Pml | 20036 | -0.231 | -0.2382 | Yes |
| 26 | Plg | 21067 | -0.288 | -0.2307 | Yes |
| 27 | Vegfa | 21074 | -0.288 | -0.1797 | Yes |
| 28 | Rtn1 | 21983 | -0.353 | -0.1554 | Yes |
| 29 | Nrcam | 22058 | -0.359 | -0.0947 | Yes |
| 30 | Nrp2 | 22664 | -0.432 | -0.0436 | Yes |
| 31 | Slit1 | 22886 | -0.474 | 0.0313 | Yes |