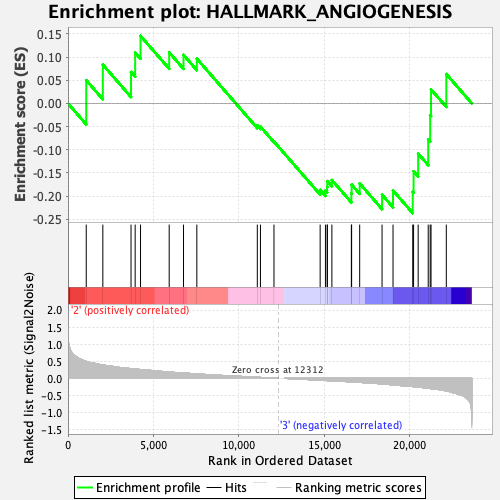
Profile of the Running ES Score & Positions of GeneSet Members on the Rank Ordered List
| Dataset | GMP.GMP.mono_Pheno.cls #Group3_versus_Group4.GMP.mono_Pheno.cls #Group3_versus_Group4_repos |
| Phenotype | GMP.mono_Pheno.cls#Group3_versus_Group4_repos |
| Upregulated in class | 3 |
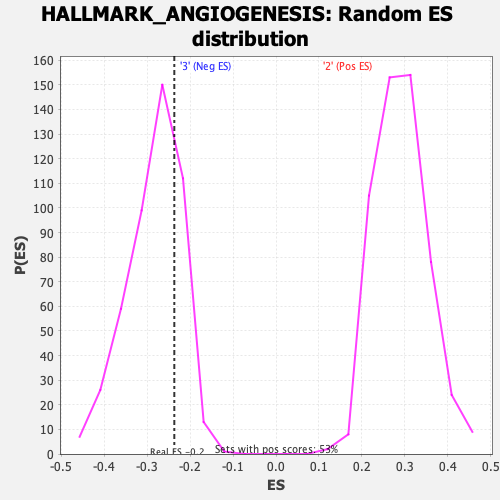
| GeneSet | HALLMARK_ANGIOGENESIS |
| Enrichment Score (ES) | -0.236577 |
| Normalized Enrichment Score (NES) | -0.83140445 |
| Nominal p-value | 0.7494647 |
| FDR q-value | 1.0 |
| FWER p-Value | 1.0 |
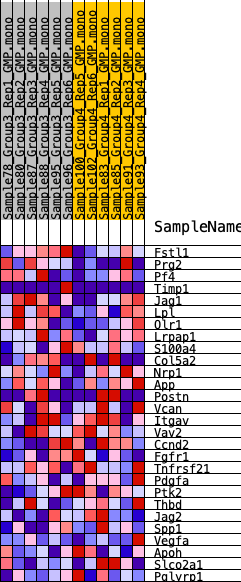
| SYMBOL | RANK IN GENE LIST | RANK METRIC SCORE | RUNNING ES | CORE ENRICHMENT | |
|---|---|---|---|---|---|
| 1 | Fstl1 | 1067 | 0.495 | 0.0499 | No |
| 2 | Prg2 | 2038 | 0.389 | 0.0835 | No |
| 3 | Pf4 | 3687 | 0.281 | 0.0677 | No |
| 4 | Timp1 | 3929 | 0.271 | 0.1096 | No |
| 5 | Jag1 | 4243 | 0.256 | 0.1456 | No |
| 6 | Lpl | 5920 | 0.184 | 0.1100 | No |
| 7 | Olr1 | 6758 | 0.157 | 0.1047 | No |
| 8 | Lrpap1 | 7537 | 0.129 | 0.0965 | No |
| 9 | S100a4 | 11075 | 0.031 | -0.0474 | No |
| 10 | Col5a2 | 11259 | 0.027 | -0.0501 | No |
| 11 | Nrp1 | 12050 | 0.007 | -0.0822 | No |
| 12 | App | 14751 | -0.053 | -0.1865 | No |
| 13 | Postn | 15061 | -0.062 | -0.1878 | No |
| 14 | Vcan | 15163 | -0.065 | -0.1797 | No |
| 15 | Itgav | 15172 | -0.065 | -0.1676 | No |
| 16 | Vav2 | 15438 | -0.071 | -0.1652 | No |
| 17 | Ccnd2 | 16577 | -0.101 | -0.1940 | No |
| 18 | Fgfr1 | 16593 | -0.102 | -0.1751 | No |
| 19 | Tnfrsf21 | 17064 | -0.117 | -0.1725 | No |
| 20 | Pdgfa | 18373 | -0.161 | -0.1969 | Yes |
| 21 | Ptk2 | 19015 | -0.189 | -0.1878 | Yes |
| 22 | Thbd | 20168 | -0.239 | -0.1907 | Yes |
| 23 | Jag2 | 20218 | -0.242 | -0.1463 | Yes |
| 24 | Spp1 | 20486 | -0.257 | -0.1083 | Yes |
| 25 | Vegfa | 21074 | -0.288 | -0.0778 | Yes |
| 26 | Apoh | 21188 | -0.298 | -0.0254 | Yes |
| 27 | Slco2a1 | 21238 | -0.301 | 0.0303 | Yes |
| 28 | Pglyrp1 | 22132 | -0.369 | 0.0632 | Yes |