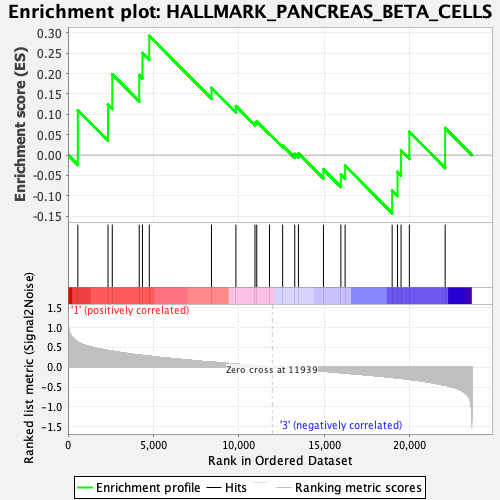
Profile of the Running ES Score & Positions of GeneSet Members on the Rank Ordered List
| Dataset | GMP.GMP.mono_Pheno.cls #Group2_versus_Group4.GMP.mono_Pheno.cls #Group2_versus_Group4_repos |
| Phenotype | GMP.mono_Pheno.cls#Group2_versus_Group4_repos |
| Upregulated in class | 1 |
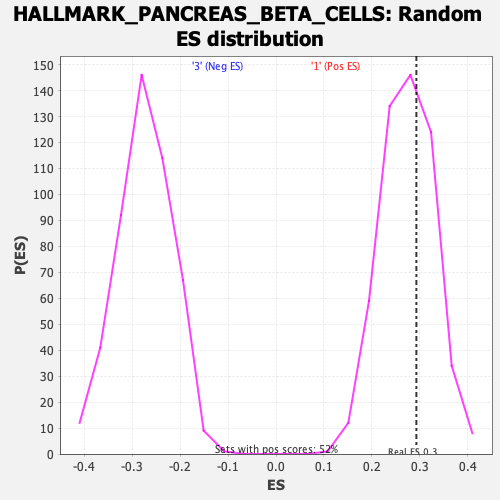
| GeneSet | HALLMARK_PANCREAS_BETA_CELLS |
| Enrichment Score (ES) | 0.29251084 |
| Normalized Enrichment Score (NES) | 1.0693666 |
| Nominal p-value | 0.38223937 |
| FDR q-value | 0.5672293 |
| FWER p-Value | 0.989 |
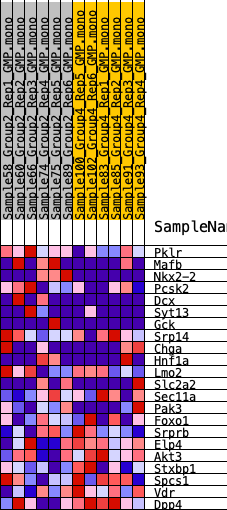
| SYMBOL | RANK IN GENE LIST | RANK METRIC SCORE | RUNNING ES | CORE ENRICHMENT | |
|---|---|---|---|---|---|
| 1 | Pklr | 575 | 0.623 | 0.1099 | Yes |
| 2 | Mafb | 2339 | 0.411 | 0.1238 | Yes |
| 3 | Nkx2-2 | 2590 | 0.394 | 0.1981 | Yes |
| 4 | Pcsk2 | 4168 | 0.301 | 0.1961 | Yes |
| 5 | Dcx | 4355 | 0.290 | 0.2506 | Yes |
| 6 | Syt13 | 4755 | 0.273 | 0.2925 | Yes |
| 7 | Gck | 8396 | 0.123 | 0.1649 | No |
| 8 | Srp14 | 9823 | 0.073 | 0.1201 | No |
| 9 | Chga | 10938 | 0.034 | 0.0803 | No |
| 10 | Hnf1a | 11042 | 0.030 | 0.0824 | No |
| 11 | Lmo2 | 11787 | 0.005 | 0.0520 | No |
| 12 | Slc2a2 | 12557 | -0.019 | 0.0234 | No |
| 13 | Sec11a | 13265 | -0.043 | 0.0027 | No |
| 14 | Pak3 | 13482 | -0.051 | 0.0045 | No |
| 15 | Foxo1 | 14944 | -0.103 | -0.0352 | No |
| 16 | Srprb | 15964 | -0.141 | -0.0479 | No |
| 17 | Elp4 | 16212 | -0.150 | -0.0261 | No |
| 18 | Akt3 | 18964 | -0.257 | -0.0872 | No |
| 19 | Stxbp1 | 19278 | -0.275 | -0.0413 | No |
| 20 | Spcs1 | 19485 | -0.283 | 0.0109 | No |
| 21 | Vdr | 19970 | -0.309 | 0.0570 | No |
| 22 | Dpp4 | 22064 | -0.454 | 0.0661 | No |